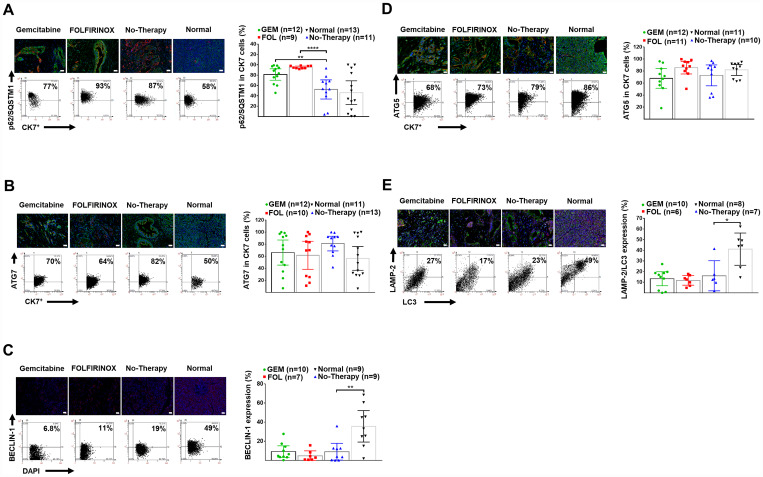
Figure 2. Human pancreatic normal and cancer tissues: expression of autophagy markers.
(A) Representative IF-stained tissues for DAPI (blue), CK-7+ tumor cells (red) and p62/SQSTM-1 (green), as well as representative FACS-like co-expression scattergrams and quantitation of p62/SQSTM-1 in CK-7+ tumor cells are blotted as mean with 95% CI as shown in Table 2. (B) Representative IF-stained tissues for ATG-7 (green), DAPI (blue), and CK-7+ tumor cells (red), as well as representative FACS-like co-expression scattergrams and quantitation of ATG-7 in CK-7+ tumor cells are blotted as mean with 95% CI as shown in Table 2. (C) Representative IF-stained tissues with or for BECLIN-1 (red) and DAPI (blue), as well as representative FACS-like co-expression scattergrams and quantitation of BECLIN-1 in DAPI cells are blotted as mean with 95% CI as shown in Table 2. (D) Representative IF-stained tissues for ATG-5 (green), DAPI (blue), and CK-7+ tumor cells (red), as well as representative FACS-like co-expression scattergrams and quantitation of ATG-5 in CK-7+ tumor cells are blotted as mean with 95% CI as shown in Table 2. (E) Representative IF-stained tissues for LAMP-2 (red), LC-3 (green) and DAPI (blue), as well as representative FACS-like co-expression scattergrams and quantitation of LC-3 with LAMP-2 are blotted as mean with 95% CI as shown in Table 2. Human tissue scale bar = 20 μm, 20× objective. * P <0.05, ** P < 0.01, *** P < 0.001, **** P < 0.0001.

