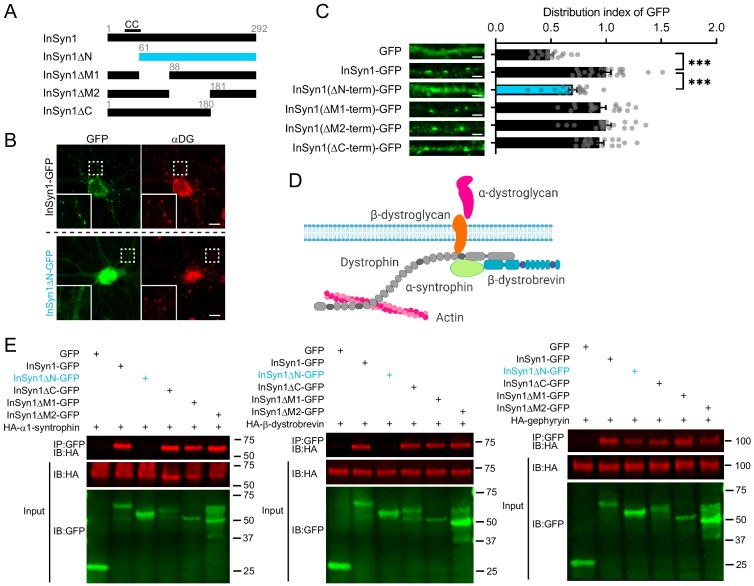
Figure 2. The N-terminus of InSyn1 is essential for its localization and interaction with DGC components.
(A) Schematic of InSyn1 deletion mutants used for co-immunoprecipitation or localization in neurons. CC: putative coiled-coil domain. (B) Representative images of full-length or ΔN InSyn1-GFP expression (green) in neurons immunostained with antibodies to αDG (red). Scale bar; 5 µm. (C) Left; representative images of dendrites expressing each construct. Right, graphs depicting the distribution index of InSyn1 versus negative control (GFP) or InSyn1 mutants. GFP (n = 18), InSyn1-GFP (n = 22), InSyn1ΔN-GFP (n = 18), InSyn1ΔM1-GFP (n = 18), InSyn1ΔM2-GFP (n = 18), InSyn1ΔC-GFP (n = 18). One-way ANOVA followed by Tukey’s post-hoc tests, F (5, 106)=23.99, ***p<0.001. Scale bars, 2 µm. (D) Schematic of the dystrophin/dystroglycan complex (DGC) in neurons. Created with BioRender.com (E) Representative immunoblots following co-immunoprecipitation of GFP (negative control), InSyn1-GFP, or InSyn1-GFP mutants with HA-α1-syntrophin, HA-β-dystrobrevin, or HA-gephyrin. Protein constructs were expressed in HEK293T cells and precipitated by GFP-Trap. IP: immunoprecipitated, IB: immunoblot.

