. 2019 Dec 12;8:e50712. doi: 10.7554/eLife.50712

Figure 3. InSyn1 expression distribution in the mouse brain.

(A) InSyn1 mRNA (white) was detected throughout the adult mouse brain with strong signals in the hippocampus, cerebellum and olfactory bulb. Nissle stain (blue). Magnified images of the hippocampus and the cortex are shown. (B) Numerous clusters were found in cells in different layers of the cortex (Cx), pyramidal cell layers (CA1) and dentate gyrus granule cells (DG) in the hippocampus, Purkinje cells in the cerebellum (Cb), cells surrounding the glomerulus (GL) and in the mitral cell layer of the olfactory bulb (OB). Cx; cerebrum cortex, CA1; hippocampus CA1, DG; dentate gyrus, Cb; cerebellum, OB; olfactory bulb, GL; glomerular layer, Mi; mitral cell layer, Gr; granular cell layer, ML; molecular cell layer, PCL; Purkinje cell layer, IGL; internal granule layer. The asterisk represents the glomerulus. Scale bars, 1 mm (A), 50 um (B).

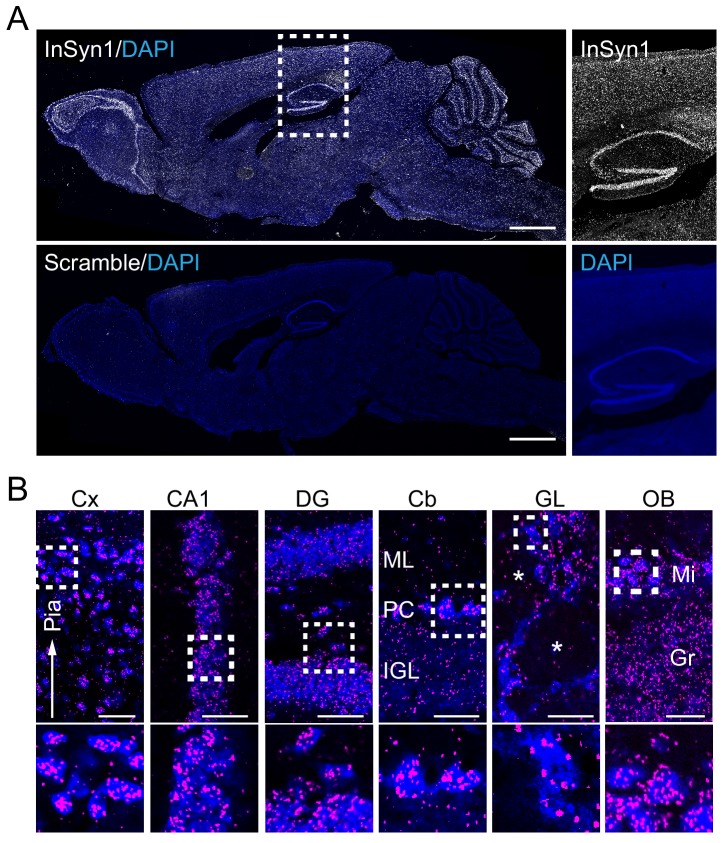
Figure 3—source data 1. Hybridization probes.

Figure 3.

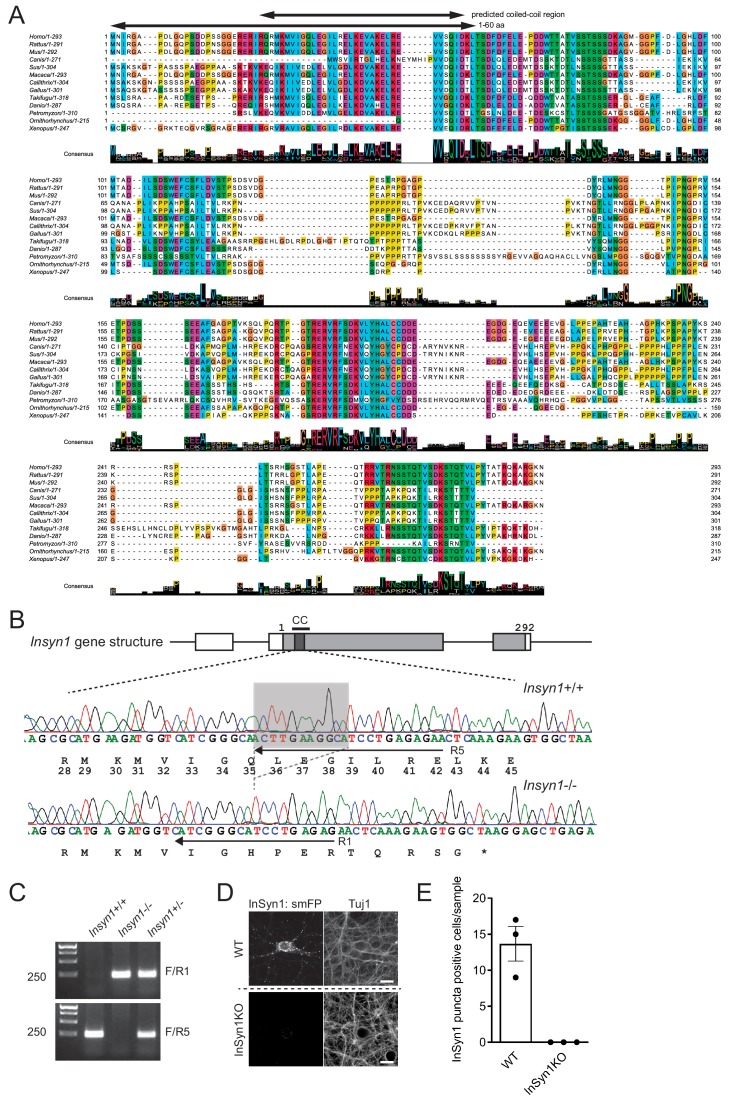
Figure 3—figure supplement 1. Generation of InSyn1 KO mice.

Figure 3—figure supplement 1.

(A) Multiple protein sequence alignment of InSyn1 from human (Homo sapiens), rat (Rattus norvegicus), mouse (Mus musculus), Dog (Canis lupus), Wild pig (Sus scrofa), monkey (Macaca fascicularis), marmoset (Callithrix jacchus), chicken (Gallus gallus), Lamprey (Petromyzon marinus), platypus (Ornithorhynchus anatinus), xenopus (Xenopus laevis), and two fish species (Takifugu rubripes), (Danio rerio), The set of sequences were chosen from the Gene Tree of human InSyn1 (ENSGT00910000144204). The sequences were aligned by multiple sequence alignment algorithm Kalign2 and manually curated by JalView (Lassmann et al., 2009). The consensus sequence with sequence logos is depicted below. The predicted coiled-coil region and the N terminus 60 amino acid-deleted InSyn1 mutant (InSyn1ΔN) are indicated above. Note the sequence similarities of InSyn1 between different species. (B) Schematic of InSyn1 gene structure (top, gray box regions representing coding sequence) and the alignment of DNA sequencing from WT (top trace) and InSyn1 (bottom trace) KO mice showing an 11bp-deletion in exon two in InSyn1 KO mice. (C) Representative images of PCR-based genotyping. F; a common forward primer. R1 and R5; reverse primers depicted in B. (D and E). HITI labeling of endogenous InSyn1 in WT and KO hippocampal neurons. (D) WT neurons exhibit clear puncta staining along the neurite while InSyn1 null neurons lost puncta staining. scale bars, 10 µm. (E) InSyn1 puncta-positive cells were quantified from three different samples. Of note, no InSyn1-positive cells were detected from null hippocampal neurons.