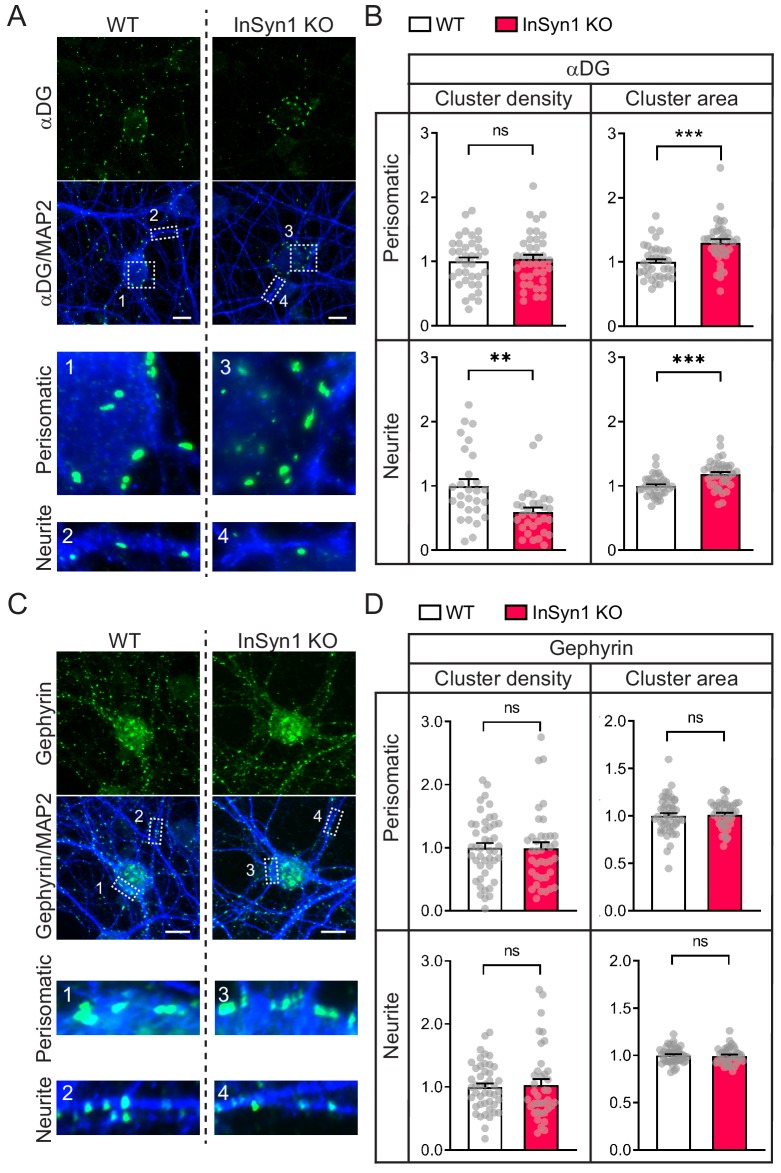
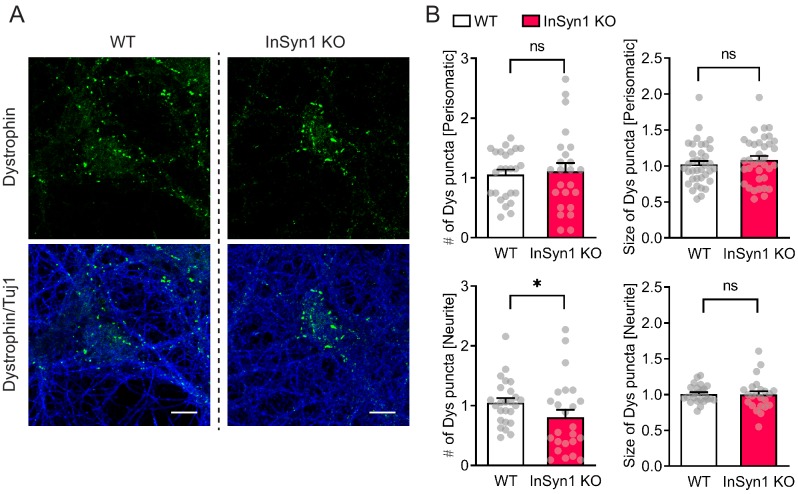
Figure 4. InSyn1 modulates the distribution of the DGC but not gephyrin in neurons.
(A) Representative images of WT and InSyn1 KO hippocampal neurons at DIV13, labeled with antibodies to αDG (green) and MAP2 (blue). Scale bars, 10 um. (B) Bar graphs showing normalized αDG cluster density or area size either at perisomatic regions or at neurite regions. Perisomatic cluster density (WT n = 36, KO n = 38, two-tailed t-test, p=0.6491), neurite cluster density (WT n = 28, KO n = 30, two-tailed t-test, p=0.0010), perisomatic cluster area (WT n = 36, KO n = 38, two-tailed t-test, p<0.0001), and neurite cluster area (WT n = 36, KO n = 38, two-tailed t-test, p<0.0001). *p<0.05, **p<0.001, ***p<0.0001. (C) Representative images of WT and InSyn1 KO hippocampal neurons labeled with antibodies to gephyrin (green) and MAP2 (blue). Scale bars, 10 µm. (D) Bar graphs showing normalized gephyrin cluster density or area size. Perisomatic cluster density (WT n = 45, KO n = 38, two-tailed t-test, p=0.5963), neurite cluster density (WT n = 45, KO n = 38, two-tailed t-test, p=0.6331), perisomatic cluster area (WT n = 45, KO n = 39, two-tailed t-test, p=0.7923), and neurite cluster area (WT n = 36, KO n = 38, two-tailed t-test, p=0.8098).
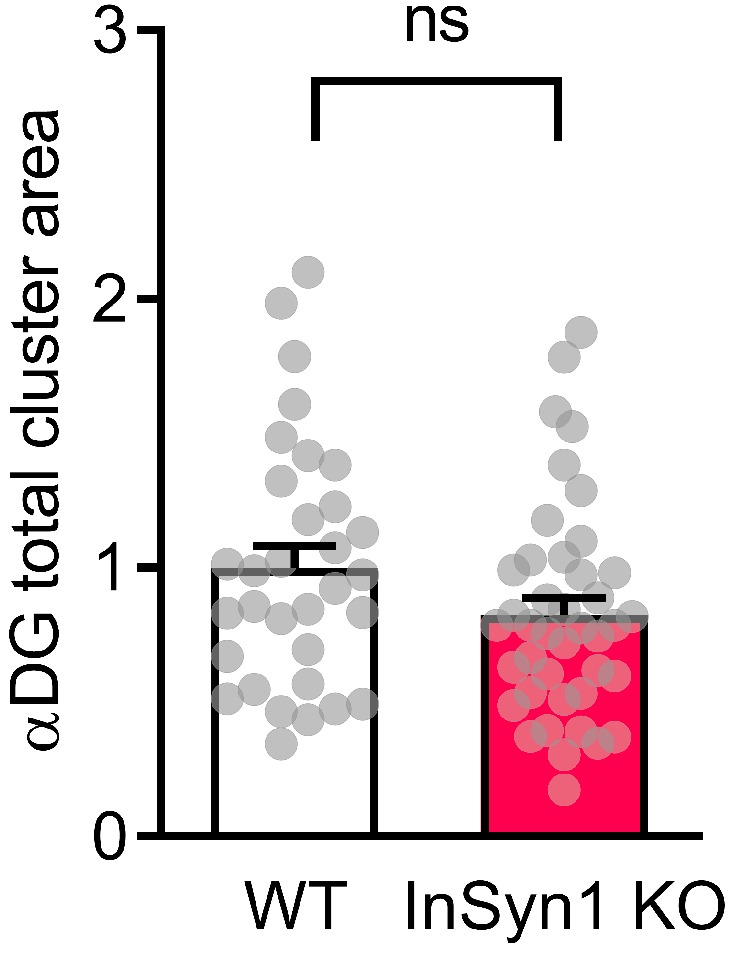
Figure 4—figure supplement 1. Quantification of αDG area in hippocampal neurons.


