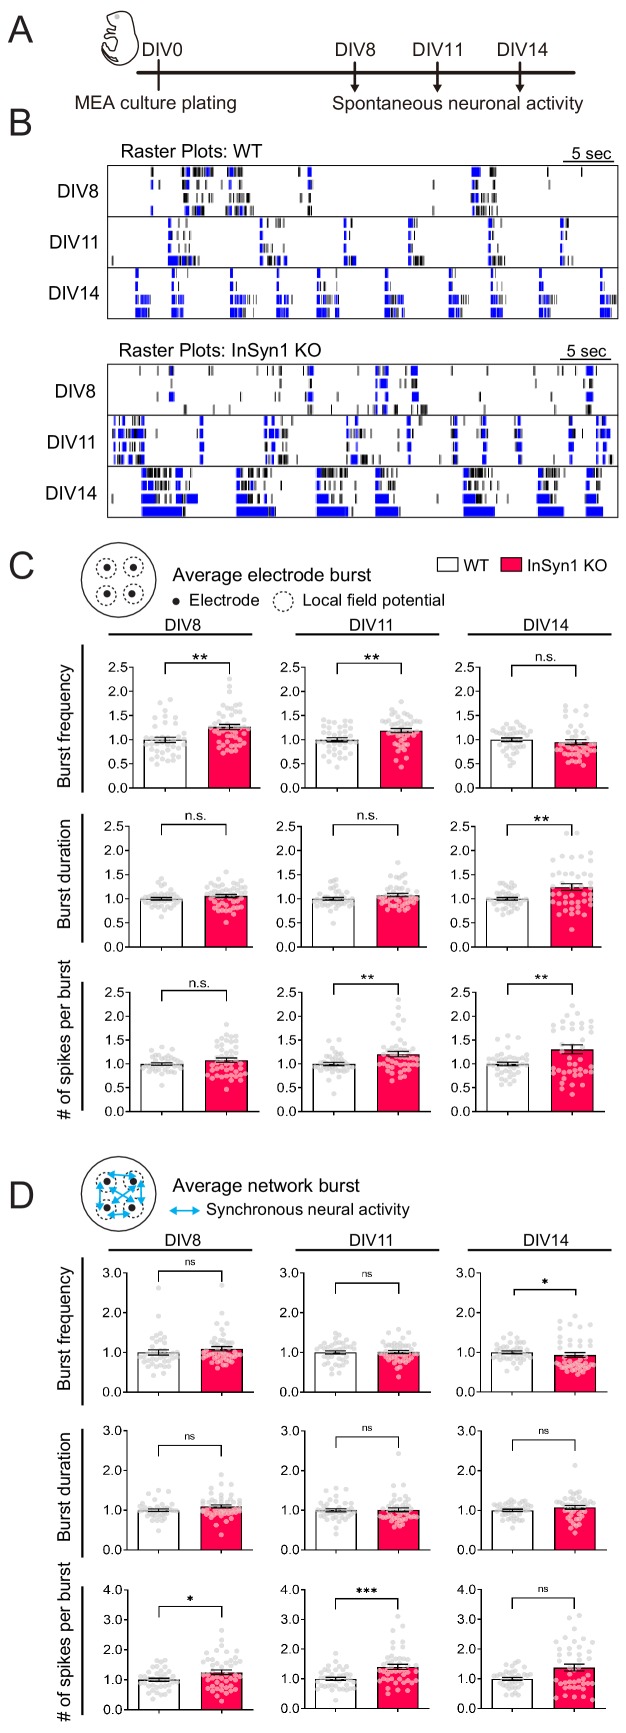
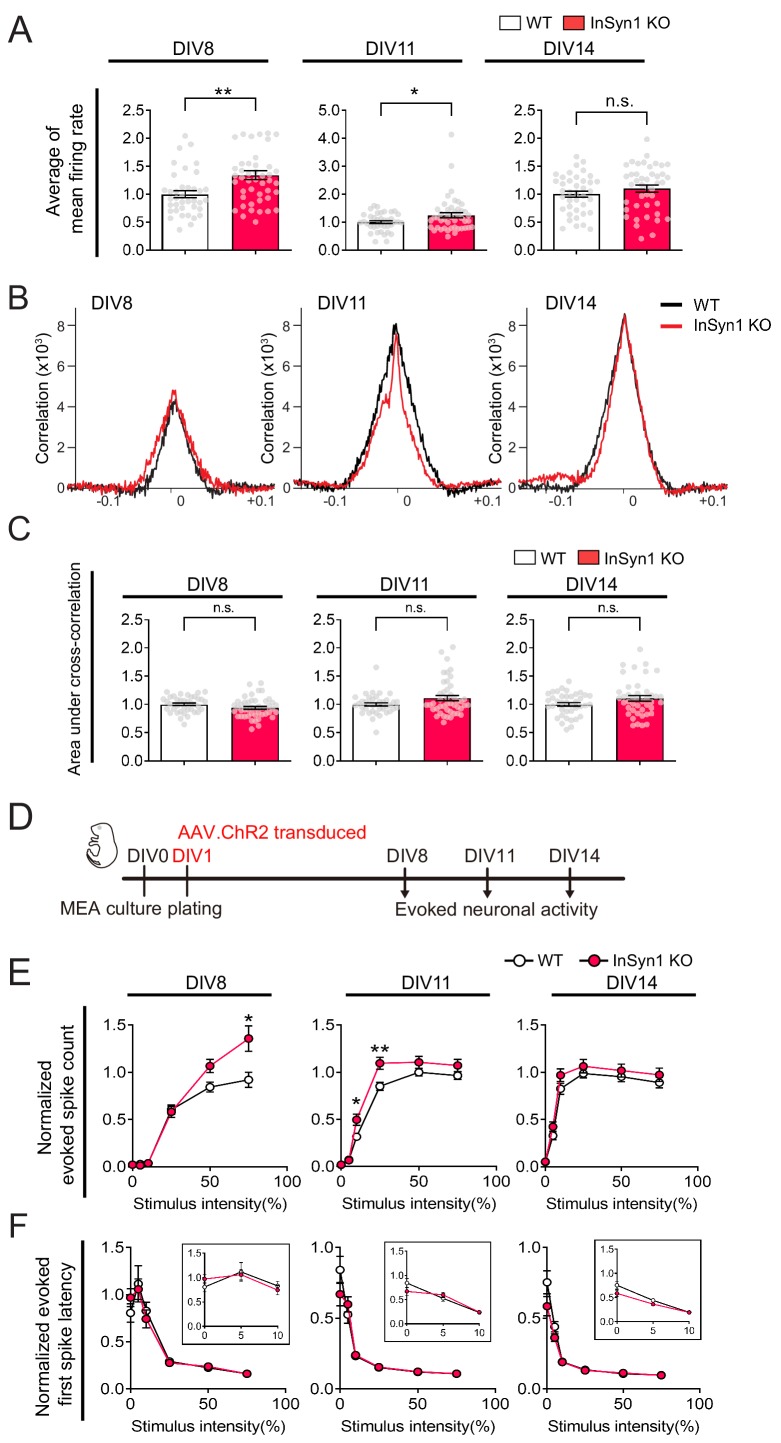
Figure 6. MEA recordings from InSyn1 KO neurons exhibit increased neuronal network activity.
(A) Experimental design to record spontaneous neuronal activity. Cultured cortical neurons were prepared from InSyn1 WT or KO neonatal pups at P0, and spontaneous neuronal activities were recorded at DIV8, 11, and 14. (B) Representative raster plots of four electrodes from each genotype recorded at DIV8, 11 and 14. Black ticks indicate the time of a spike occurred, and blue ticks indicate the spikes are part of single-electrode burst activity. (C) KO neurons showed increased spontaneous activity compare to WT at early time points. Bar graphs showing normalized average of burst frequency (Two-tailed t-test. DIV8, WT n = 38, KO n = 46, p=0.0010. DIV11, WT n = 38, KO n = 45, p=0.0026. DIV14, WT n = 39, KO n = 43, p=0.1064), normalized average of burst duration (Two-tailed t-test. DIV8, WT n = 38, KO n = 46, p=0.1689. DIV11, WT n = 38, KO n = 45, p=0.1195. DIV14, WT n = 39, KO n = 43, p=0.0021), and normalized average of number of spikes per burst (Two-tailed t-test. DIV8, WT n = 38, KO n = 46, p=0.1460. DIV11, WT n = 38, KO n = 45, p=0.0093. DIV14, WT n = 39, KO n = 43, p=0.0038). **p<0.001. (D) Measurements of synchronous neuronal activities. Bar graphs showing the normalized average of network burst frequency (Two-tailed t-test. DIV8, WT n = 38, KO n = 46, p=0.1253. DIV11, WT n = 38, KO n = 45, p=0.8531. DIV14, WT n = 39, KO n = 43 from three plates, p=0.0395.), normalized average of network burst duration (Two-tailed t-test. DIV8, WT n = 38, KO n = 46, p=0.0742. DIV11, WT n = 38, KO n = 45, p=0.7676. DIV14, WT n = 39, KO n = 43, p=0.1380), and normalized average number of spikes per network burst (Two-tailed t-test. DIV8, WT n = 38, KO n = 46, p=0.0104. DIV11, WT n = 38, KO n = 45, p=0.0003. DIV14, WT n = 39, KO n = 43, p=0.0745). *p<0.05. ***p<0.001.

