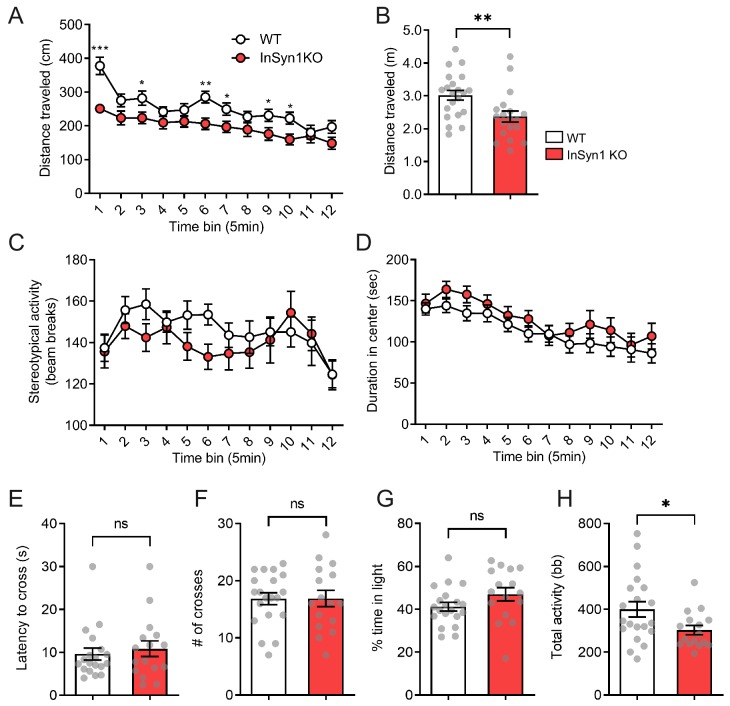
Figure 7. InSyn1- /- mice exhibit hypoactivity.
Analysis of open field exploration behavior (A–D). (A) Distance traveled in the open field over 1 hr shown in 5 min time blocks (ANOVA with repeated measure, WT n = 21, KO n = 21, main effects of group F(1, 38)=8.359, p=0.06, post-hoc t-test). (B) The plot of the total distance traveled (Two-tailed t-test, p=0.0066). (C) Graph of stereotypy behavior (ANOVA with repeated measure, WT n = 21, KO n = 21, no group difference for genotype F(1, 38)=1.186, p=0.283). (D) The plot of the duration spent in the center of the field (ANOVA with repeated measure, WT n = 21, KO n = 21, no group difference for genotype F(1, 38)=1.314, p=0.259). (E–F). Graphs depicting data from the light-dark transition test for: (E) Measurement of the latency to enter the light area (Two-tailed t-test, WT n = 19, KO n = 16, p=0.5970); (F) Total crosses between the areas (Two-tailed t-test, WT n = 20, KO n = 16, p=0.9888); (G) Time spent in the light area (Two-tailed t-test, WT n = 20, KO n = 16, p=0.1295); and (H) Total activity (Two-tailed t-test, WT n = 20, KO n = 16, p=0.0265). bb; beam break. *p<0.05, **p<0.01, ***p<0.001.

