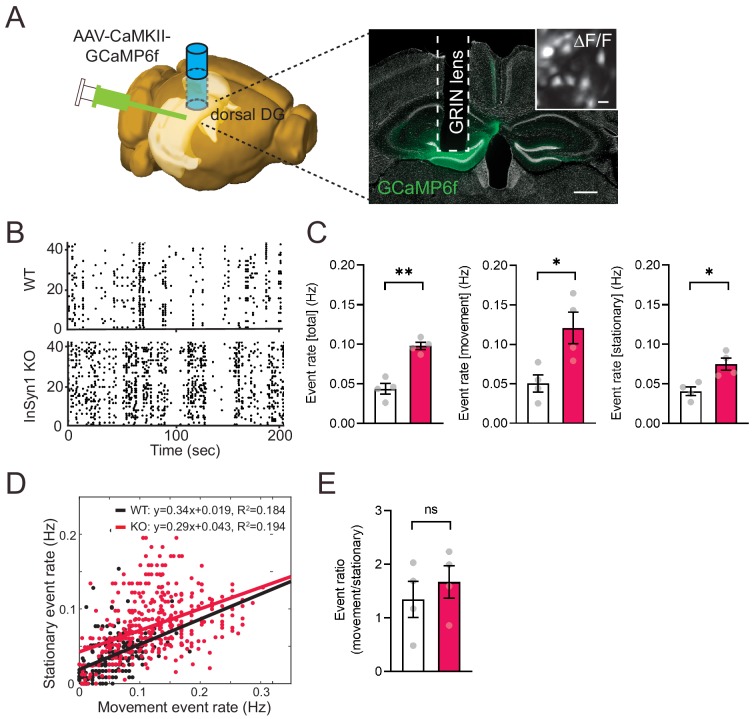
Figure 8. InSyn1- /- mice exhibit elevated neuronal activity in the dentate gyrus.
(A) Left; experimental design showing unilateral AAV-CaMKII-GCaMP6f injection into the DG of the dorsal hippocampus. The image was generated by the Allen Institute Brain Explorer two software (http://mouse.brain-map.org/static/brainexplorer). Right; an image of GCaMP6f expression and the position of the implanted GRIN lens. Scale bar; 500 um. A ΔF/F transformed image is inserted. Scale bar; 20 µm. (B) Representative images of a Ca2+-transient-raster plot from 40 cells. (C) Measurements of Ca2+ event rate. (Two-tailed t-test, WT n = 4, KO n = 4, total, p=0.0011. movement, p=0.0269. stationary, p=0.0143). *p<0.05, **p<0.01. (D) Scatter plot of movement and stationary state-related Ca2+-transient frequency recorded from WT and InSyn1 KO mice. (E) Bar graph showing the Ca2+-transient event ratio of movement to stationary (Two-tailed t-test, WT n = 4, KO n = 4, p=0.496).

