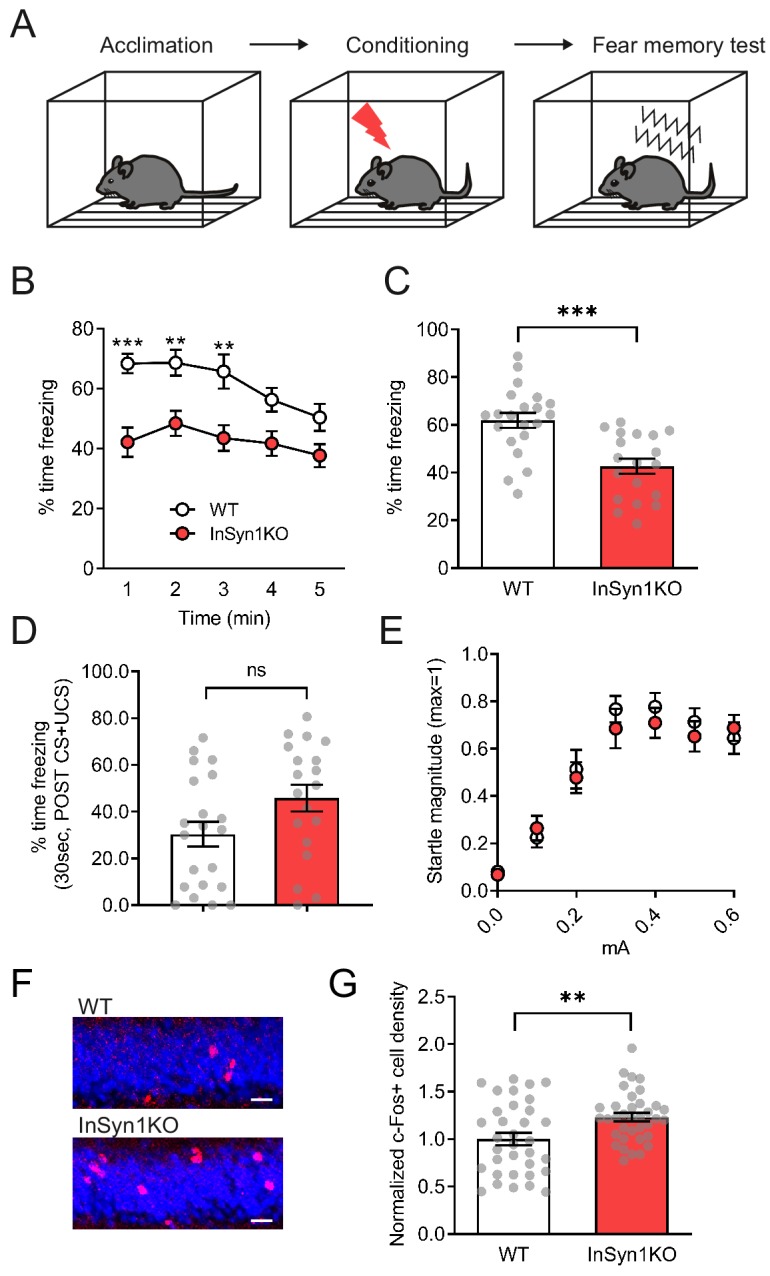
Figure 9. InSyn1- /- mice exhibit reduced memory recall and elevated c-Fos staining in contextual fear conditioning.

(A) Experimental scheme of contextual fear conditioning. After acclimation, mice receive a mild aversive foot-shock in a conditioning chamber. The next day, freezing upon placement in the chamber (without shock) was assessed. (B) Graph of startle responses to foot shock. Mice were exposed to different intensities of foot shock and the vertical acceleration was quantified and normalized. Two-way repeated measure ANOVA, Genotype effect, F (1, 29)=0.7095, p=0.4065. (C) Graph of the freezing response after shock stimulation between WT and KO mice. (D) Line graph representing the time of freezing in 1 min time bins during the fear memory test. Two-way repeated measure ANOVA, Genotype effect, F(1, 38)=18.38, p=0.0001. Bonferroni post-hoc analysis, 1 min p=0.0004, 2 min p=0.0085, 3 min p=0.0172, 4 min p=0.0735, 5 min p=0.1928. *p<0.05, **p<0.01, ***p<0.001. (E) Graph showing the total time of freezing is reduced more than 30% in InSyn1 KO mice compared to the WT littermates (WT n = 21, KO n = 19, two-tailed t-test, p<0.0001). (F) Representative images of hippocampus DG from WT and InSyn1KO stained for c-Fos (red) and Nissl (blue). Scale bars; 20 µm. (G) Bar graph represents c-Fos positive cell density in the DG regions of WT and KO hippocampal tissues. (Two-tailed t-test, WT n = 34 from four brains, KO n = 36 from five brains, p=0.0078). **p<0.01, ***p<0.001.
