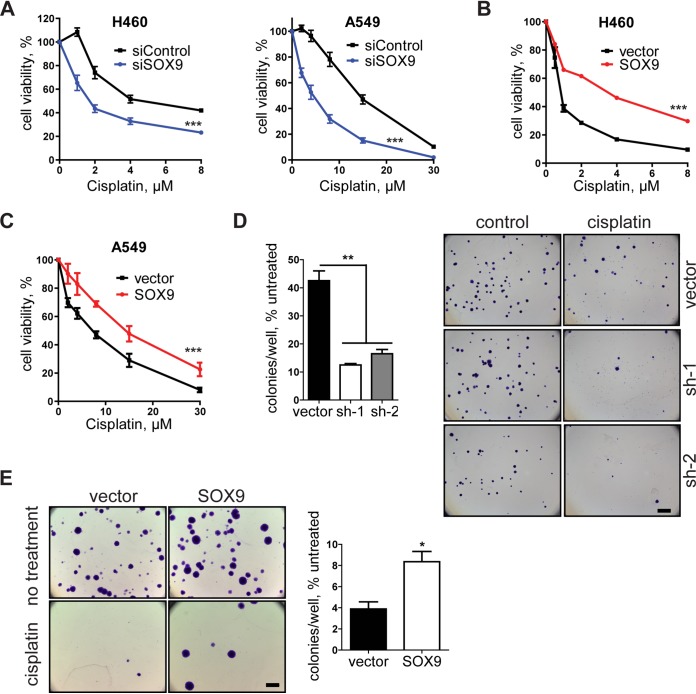
FIG 2.
SOX9 promotes chemoresistance in NSCLC cells. (A) Dose-response curves of H460 and A549 cells transfected with control siRNA (siControl) and SOX9 siRNA (siSOX9). Cell viability was evaluated by the MTT assay following a 3-day cisplatin treatment. The results are representative of those from 3 independent experiments with 4 technical replicates in each. The data are presented as the mean ± SD. (B) Dose-response curve of the empty vector and SOX9-overexpressing H460 cells following a 3-day cisplatin treatment. SOX9 expression was induced by doxycycline treatment 5 days prior to the experiment. The results are representative of those from 5 independent experiments with 5 technical replicates in each. The data are presented as the mean ± SD. ***, P < 0.0001 by two-way ANOVA. (C) Same as panel B but for A549 cells. (D) (Left) Colony formation assay in vector control and SOX9 knockdown H460 cells. Cells were treated with 4 μM cisplatin for 2 days and were then off cisplatin for 4 days and allowed to form colonies for 10 days. The data are presented as the mean ± SD and are for 2 biological replicates. **, P = 0.0021 by one-way ANOVA with Tukey’s multiple-comparison test. (Right) The cells were then fixed, stained with crystal violet, and visualized by light microscopy. Bar = 3 mm. (E) Same as for panel D but with SOX9-overexpressing cells exposed to 2 μM cisplatin. The data are for 3 biological replicates. *, P = 0.0125 by unpaired two-tailed t test.

