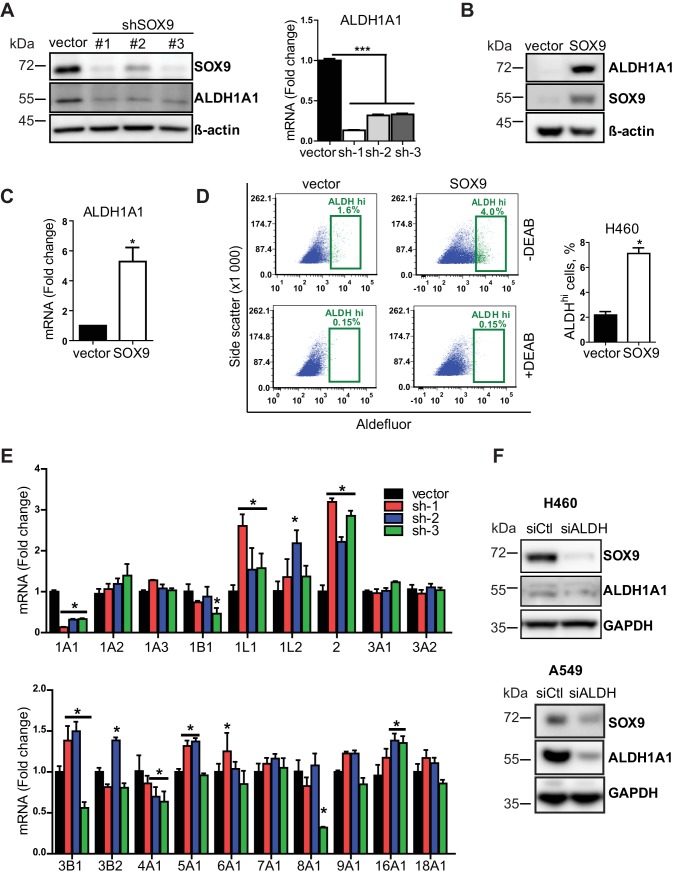
FIG 5.
ALDH1A1 is a downstream target of SOX9. (A) (Left) Representative Western blot analysis of SOX9 and ALDH1A1 expression in SOX9 knockdown (shRNA #1, #2, and #3) and empty vector H460 cells. (Right) ALDH1A1 mRNA levels in the same cells. The data are presented as the mean ± SEM (n = 3). ***, P < 0.0001 by one-way ANOVA with Tukey’s multiple-comparison test. (B) Representative Western blot showing an increased expression of ALDH1A1 in SOX9-overexpressing H460 cells. The data are from 6 independent experiments. (C) SOX9 overexpression-induced ALDH1A1 mRNA levels in H460 cells. The data are presented as the mean ± SD from 7 independent experiments. P was 0.004 by a paired t test. (D) Analysis of ALDH activity by the Aldefluor assay in empty vector and SOX9-overexpressing H460 cells. (Left) A representative flow cytometry gating for the Aldefluor assay; (right) percentage of cells with high ALDH activity. The data are from 3 independent experiments with 2 biological replicates each. The data are presented as the mean ± SD. *, P < 0.001 by a paired two-tailed t test. DEAB, N,N-diethylaminobenzaldehyde, which is an ALDH inhibitor used to set up the background fluorescence level for all flow cytometry experiments. (E) RT-qPCR analysis of 19 ALDH isoforms in SOX9 knockdown (sh-1, -2, and -3) and empty vector H460 cells. The data are presented as the mean ± SD. *, P < 0.05 compared to the vector cells by two-way ANOVA followed by Bonferroni posttests. (F) ALDH1A1 knockdown decreased SOX9 expression. siCtl, control siRNA; siALDH, ALDH siRNA.

