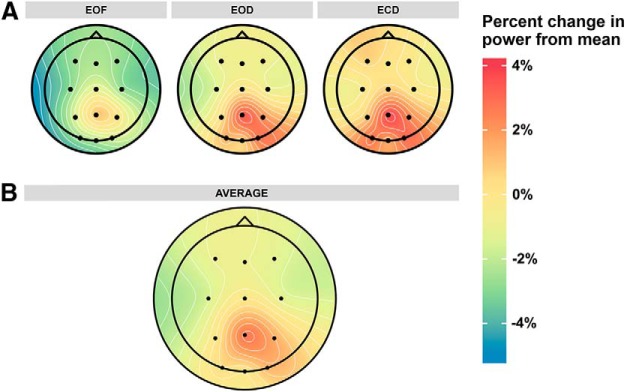
Figure 4.
Distribution of normalized α power across the scalp. Power is plotted as percentage change from the mean across all resting state conditions, electrodes, and subjects to better illustrate the differences in power occurring across different resting state conditions. Power values that deviate strongly from the grand mean will be non-zero in the averaged data. A, Normalized α power in each resting state condition. B, Normalized α power averaged across resting state conditions.

