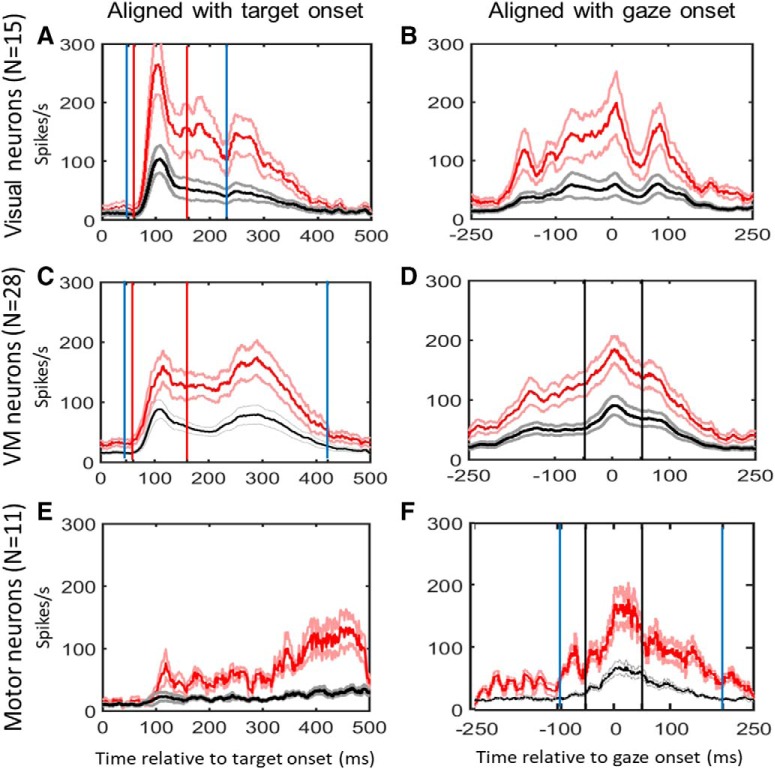
Figure 2.
Mean spike density plots for our visual neurons (A, B, N = 15), VM neurons (C, D, N = 28), and motor neurons (E, F, N = 11) during the reactive task. These sub-populations were identified using the memory delay task (Sadeh et al., 2015), not shown here. Data are aligned with stimulus onset (left column) and gaze movement (right column). These data were averaged across all data that passed our exclusion criteria. Red lines represent spike density plots derived from the “top 10%” trials in the reactive task (±SEM, light red lines), generally corresponding to the RF hot spot, and the black lines are derived from the average firing rate across all trials (±SEM, gray lines). Solid blue vertical lines indicate the average temporal analysis window for the full burst analysis, whereas red and black vertical lines indicate the time intervals sued for the fixed-window analysis in visual and motor activities, respectively.

