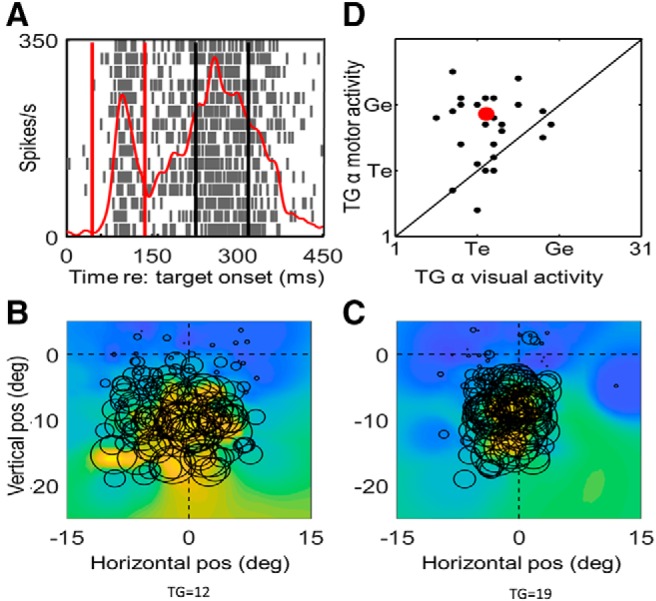
Figure 4.

Shift from Te to Ge coding within VM Neurons. A, Raster/spike density plot of a representative VM neuron aligned on target onset, showing fixed visual window (red lines) and average location of fixed motor window (black lines). This is followed by the best RF fit plots for the fixed (B) visual and (C) fixed motor activities. The circles on B, C represent the location of target. D, The scatter plot of differences in T-G α values of visual (x-axis) and motor (y-axis) of VM neurons (black circles) relative to the equality diagonal line. The average of the T-G α values in represented by the red circle and the representative example shown in A–C is indicated as the red circle. Most neurons lie above the line which indicates that there is a transition from coding for target location in the visual activity to gaze end location in the motor activity within the individual VM neurons. This shift was significant (paired two-tailed t test, p = 0.001).
