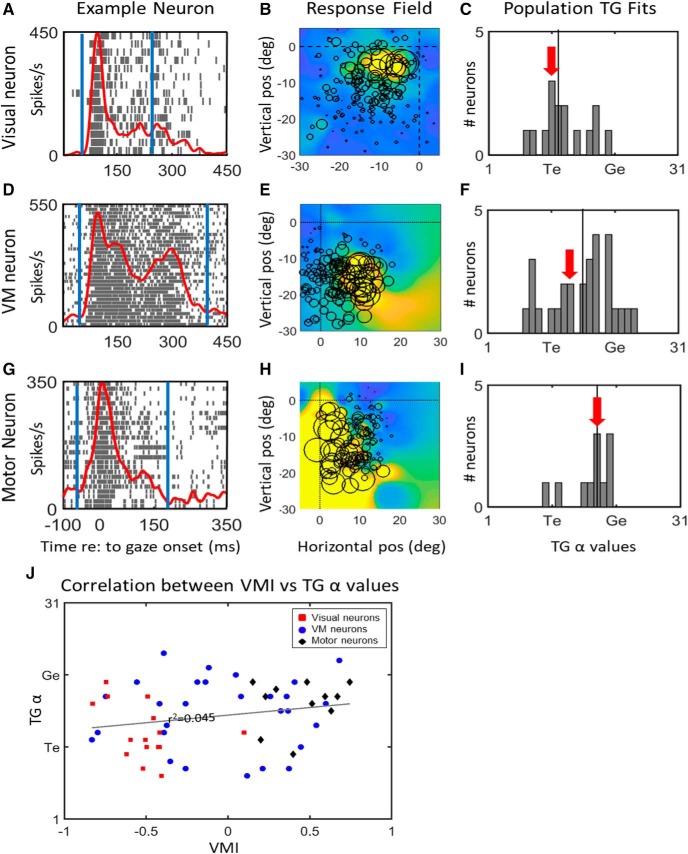
Figure 5.
A–I, The T-G α value distribution for full burst analysis of visual (top row 1, A–C), VM (row 2, D–F), and motor (row 3, G–I) neural populations in the reactive task. Each row shows an example neuron’s spike density plot/raster (column 1) and receptive field (column 2), and then a frequency histograph of best T-G fits for all neurons in that population. Spatial fits were made for each neuron using data derived the entire duration of task-related neural activity (between blue vertical lines in left column), aligned on stimulus onset. The vertical line in each panel of the right column indicates the median of the T-G α values and the red arrow indicate the T-G value of the representative example. J, T-G α values plotted as a function of VMI for each neuron population. All neuron categories exhibit a weak, non-significant correlation: visual neurons are represented by red squares (r 2 = 0.1492, p = 0.155), VM neurons by blue circles (r 2 = 0.0012, p = 0.86) and motor neurons by black diamonds (r 2 = 0.041, p = 0.55). The overall correlation across all neurons (indicated by the gray correlation line) also leads a weak (r 2 = 0.045) non-significant (p = 0.123) correlation between the two variables.

