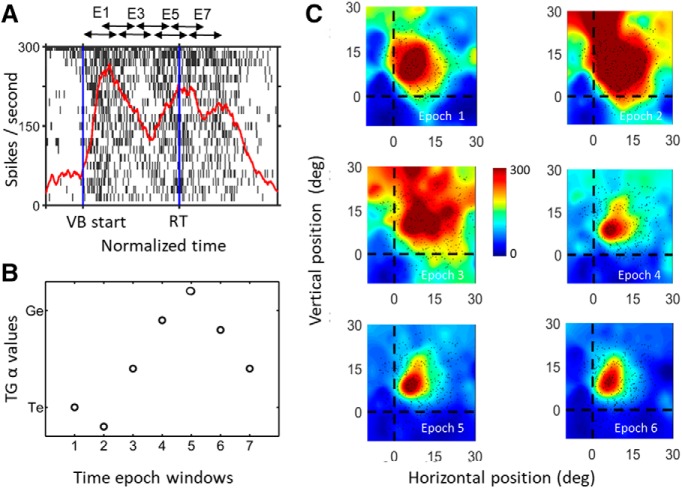
Figure 6.
Spatiotemporal analysis in one example neuron. A, Action potential raster plot and spike density plot of a representative VM neuron during the reactive task. The spike density plot (thick red line) was derived from the trials with the top 10% of activity (N = 19), i.e., when the target was presented at the hot spot of the RF. The dark blue vertical lines indicate the normalized sampling window of the VM burst, with first blue line indicating the start of the visual burst (VB) and the second blue line indicating the normalized reaction time (RT). The x-axis represents the normalized time relative to target onset, and the y-axis represents the firing rate. The double headed arrows on top of the raster plot indicate the semi-overlapping time windows which were used for the RF and T-G value analysis shown in B, C. These sampling windows were normalized according to the duration of the action potential (–370–200 ms from VB onset to movement onset) to yield seven semi-overlapping windows with equal time periods. B, T-G continuum values plotted as a function of their sequence through time (1–7). In this case, there is a rise from T toward G over the first five steps followed by a slight reversal. The details of these patterns varied across neurons. C, RF fits for the activity from time windows 1–6, plotted in the best fit reference frame along the target-gaze continuum (epoch 7 looked the same as 6). The dots indicate spatial positions of the targets in this frame for each trial and the color heat map (blue = low activity, red = high activity).

