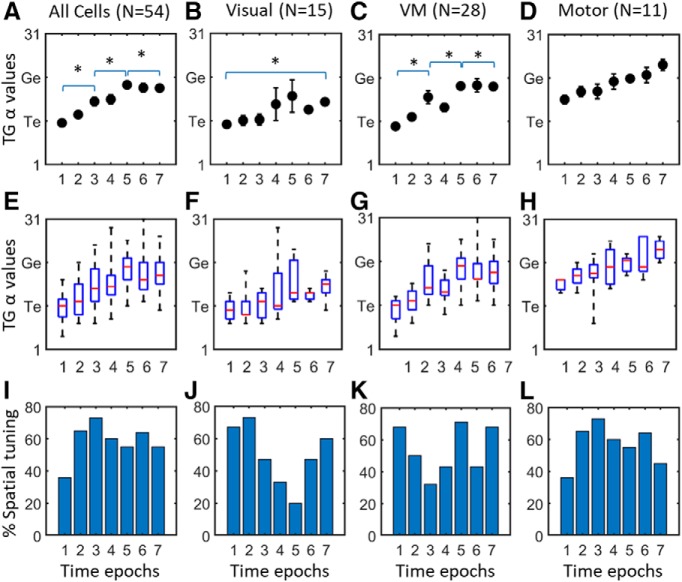
Figure 7.
Spatiotemporal analysis in entire SC neuron population (column 1) and each subpopulation (columns 2–4). Top row (A–D) shows the mean T-G α values (y-axis) of each temporal window of analysis (x-axis) with SEM bars, the middle row (E–H) shows the median values (red bars) as well as first and third quartiles (blue bars) of T-G α values (y axes) for the same data, and the bottom row (I–L) shows the percentage of cells in each time epoch that showed significant spatial tuning. The entire neuron population (column 1, N = 56), showed a progressive shift in each step from more Te related coding in the earlier visual activity to more Ge related as the activity becomes closer to gaze onset. The visual neuron population (row 2, N = 15) which showed a predominantly preference in coding for target especially in earlier windows with a non-significant shift toward intermediate T-G α value later in its activity (one-way ANOVA p = 0.402). The VM population (row 3, N = 28) showed a significant shift in T-G α values (one-way ANOVA p = 0.0001). The motor population (row 4, N = 11) started at a more intermediate T-G value and showed a non-significant shift toward G (one-way ANOVA p = 0.48). The significant differences between time epochs -pointed at by the end tips of the brackets (p < 0.05) are indicated by asterisk (*). However, as described in the text, there was no significant difference between these three patterns. Note that for the results shown in Figure 5A–H, the T-G values were included in the analysis only if the neuronal activity showed spatial tuning for that given analysis window.

