Figure 3.
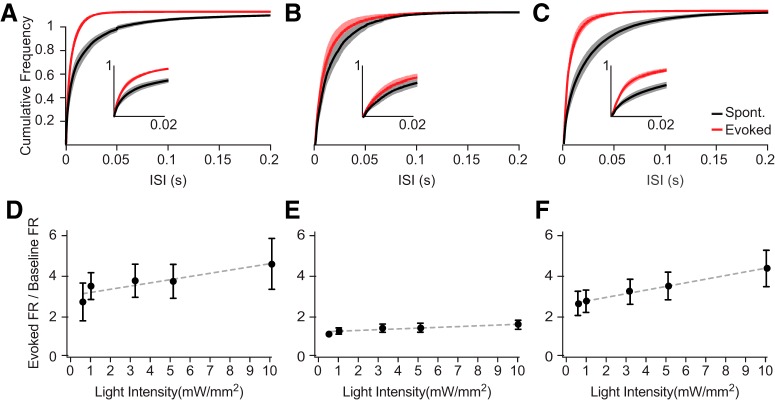
Amplitude and frequency distribution of evoked spike response varies with optogenetic tool. A, ISIs of spontaneous (black) and evoked (red) MU activity during optogenetic stimulation (10 mW/mm2) in ChR2-expressing cortex. Inset shows an enlarged plot of the initial 200 ms of the evoked spike response. B, Same as in A, for Chronos. C, Same as in A, for Chrimson. Error bars denote SEM. D, Firing rates evoked by ChR2 stimulation over a range of intensities, divided by baseline spontaneous firing immediately before the light pulses. E, Same as in D, for Chronos. F, Same as in D, for Chrimson. Dashed lines indicate linear regression of the data. Error bars denote SEM.

