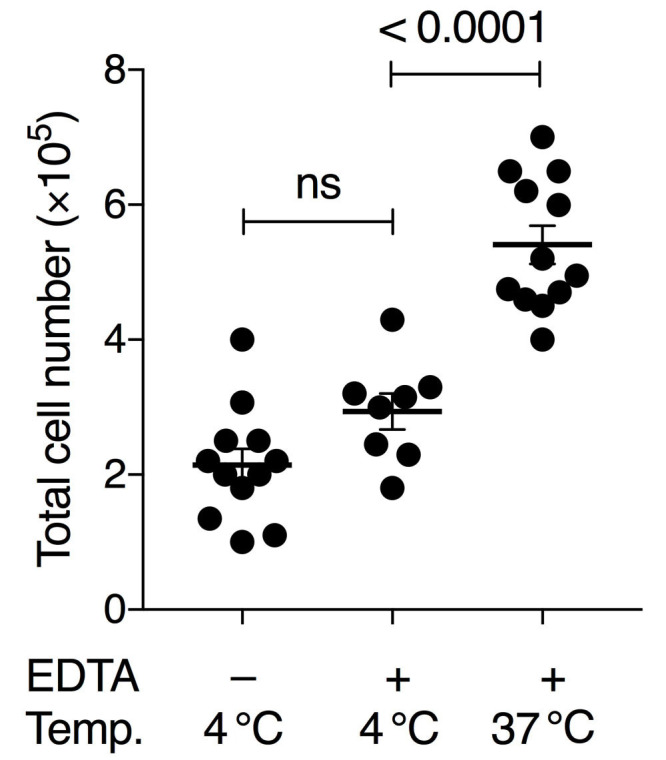
Figure 1. Comparison of BAL conditions using pre-cooled or pre-warmed PBS with or without 2 mM EDTA.

Either 4 °C PBS without EDTA, 4 °C PBS with 2 mM EDTA and 0.5% FBS, or 37 °C PBS with 2 mM EDTA and 0.5% FBS was used. Numbers show the total amount of living cells (Trypan-Blue-negative) per BAL treatment per mouse. Each symbol denotes the mean cell count of 3 technical replicates of an individual mouse; horizontal lines indicate the mean, error bars show standard error of the mean (SEM); one-way ANOVA with Tukey’s multiple comparisons test; ns, non-significant.
