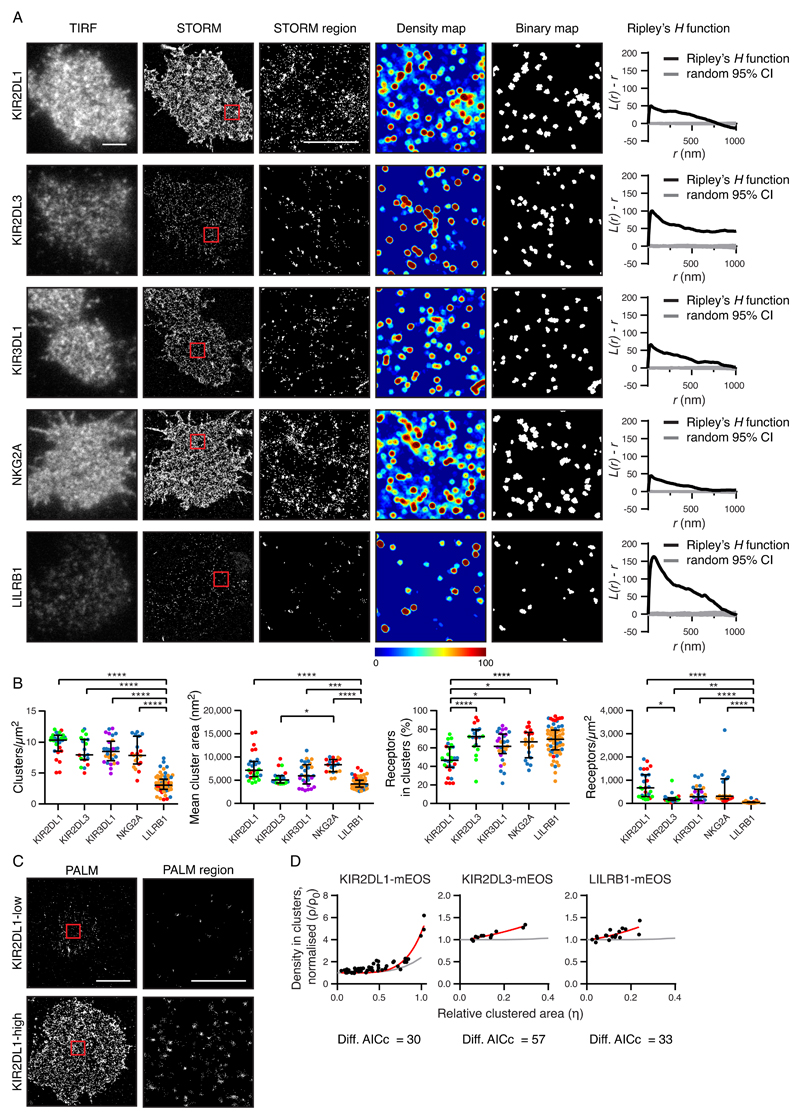
Fig. 1. Inhibitory receptors encoded by different genes have distinct nanometer-scale arrangements.
(A) Representative TIRF microscopy and STORM images of pNK cell clones (scale bar: 3 μm). STORM panels show the Gaussian-rendered image of coordinate data. The 2 × 2 μm regions (red boxes in the STORM images) are magnified, and the corresponding scatter plots, density maps (G&F analysis), and binary maps are shown (scale bar: 1 μm). The Ripley’s H function is plotted for a 3 × 3 μm region containing the enlarged region. CI, confidence interval of randomized control. (B) Quantitative analysis of binary maps. Each dot represents the mean value for a cell, and different colors represent different donors. Black bars show the median and interquartile range (IQR). Kruskal-Wallis test with Dunn’s multiple comparisons: *P < 0.05, **P < 0.01, ***P < 0.001, ****P < 0.0001; KIR2DL1 (27 cells, 3 donors), KIR2DL3 (19 cells, 3 donors), KIR3DL1 (29 cells, 3 donors), NKG2A (19 cells, 3 donors), and LILRB1 (65 cells, 3 donors). (C) Representative PALM images of YTS cells expressing low and high amounts of KIR2DL1 tagged with a photoactivatable protein (mEos2). PALM images (scale bar: 5 μm) contain 2 × 2 μm regions (red boxes) that are magnified and shown as scatter plots (scale bar: 1 μm). (D) The normalized density within clusters [according to (24); see Materials and Methods] was plotted against the relative clustered area for three different receptors. Akaike’s Information Criteria (AICc) were used to compare theoretical curves for randomly organized events (gray lines) with the best fit curves (red lines). KIR2DL1 (73 cells, five experiments), KIR2DL3 (11 cells, two experiments), and LILRB1 (18 cells, three experiments). See also figs. S1 to S3, for details on how NK clones were selected, various imaging control experiments, and how alternative methods for image analysis led to similar conclusions.

