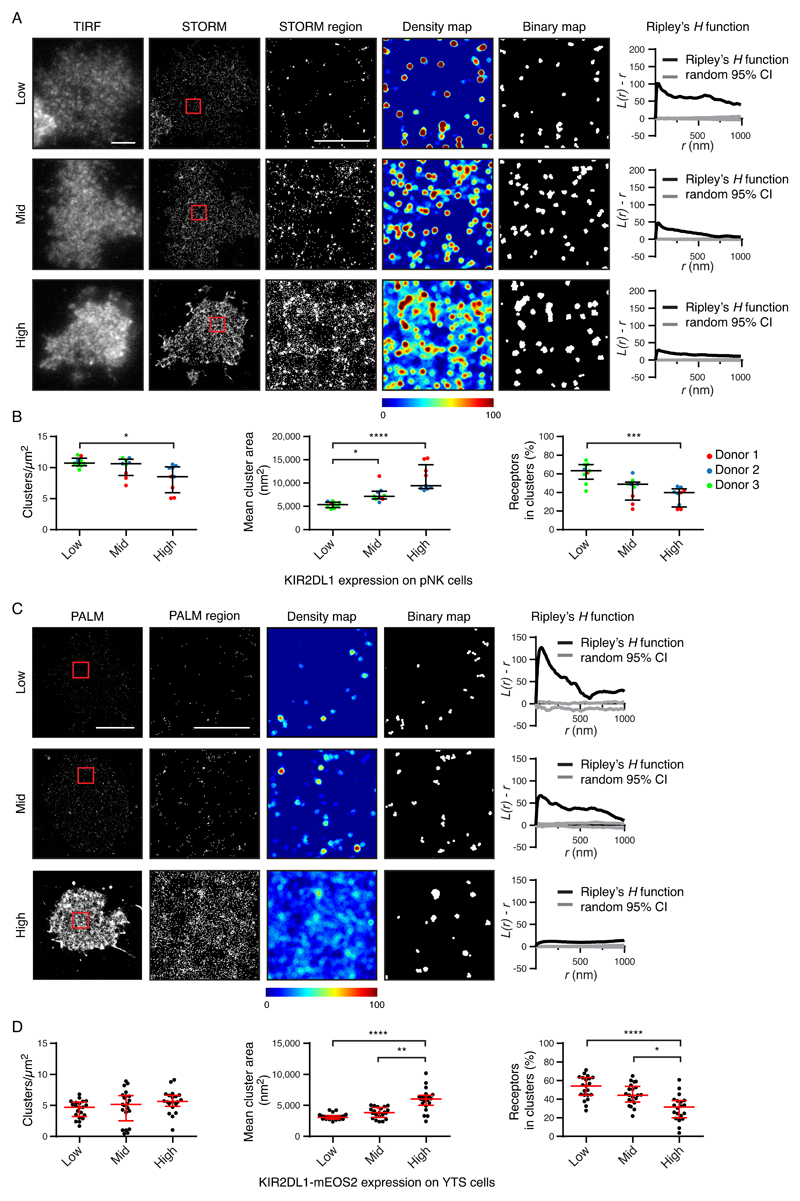
Fig. 4. The abundance of KIR2DL1 determines its nanoscale organization.
(A and B) The KIR2DL1+ pNK cell clones analyzed in Fig. 1 are presented stratified according to receptor abundance. (A) Representative TIRF microscopy and Gaussian-rendered STORM images (scale bar: 3 μm) are shown. The 2 × 2 μm regions (red boxes) are magnified, and the corresponding scatter plots, density maps, and binary maps are shown (scale bar: 1 μm). The Ripley’s H function is plotted for a 3 × 3 μm region containing the enlarged region. (B) Quantitative analysis of the binary maps. Each dot represents the mean value for a cell and different colors represent different donors. Black bars show the median and IQR. Kruskal-Wallis test with Dunn’s multiple comparisons: *P < 0.05, ***P < 0.001, ****P < 0.0001; 9 cells per tertile; three experiments. (C and D) The YTS cells expressing KIR2DL1-mEos2 analyzed in Fig. 1 were stratified according to receptor abundance. (C) Representative Gaussian-rendered PALM images (scale bar: 5 μm) contain 2 × 2 μm regions (red boxes) that are magnified, and the corresponding scatter plots, density maps, and binary maps are shown (scale bar: 1 μm). The Ripley’s H function is plotted for a 3 × 3 μm region containing the enlarged region. (D) Quantitative analysis of the binary maps. Each dot represents the mean value for a cell and the red bars show the median and IQR. Kruskal-Wallis test with Dunn’s multiple comparisons: 20 to 21 cells per tertile, five experiments. *P < 0.05, **P < 0.01, ****P < 0.0001. See also figs. S6 and S7 for analogous data for KIR3DL1, and for KIR2DL1 as assessed by an alternative imaging method.

