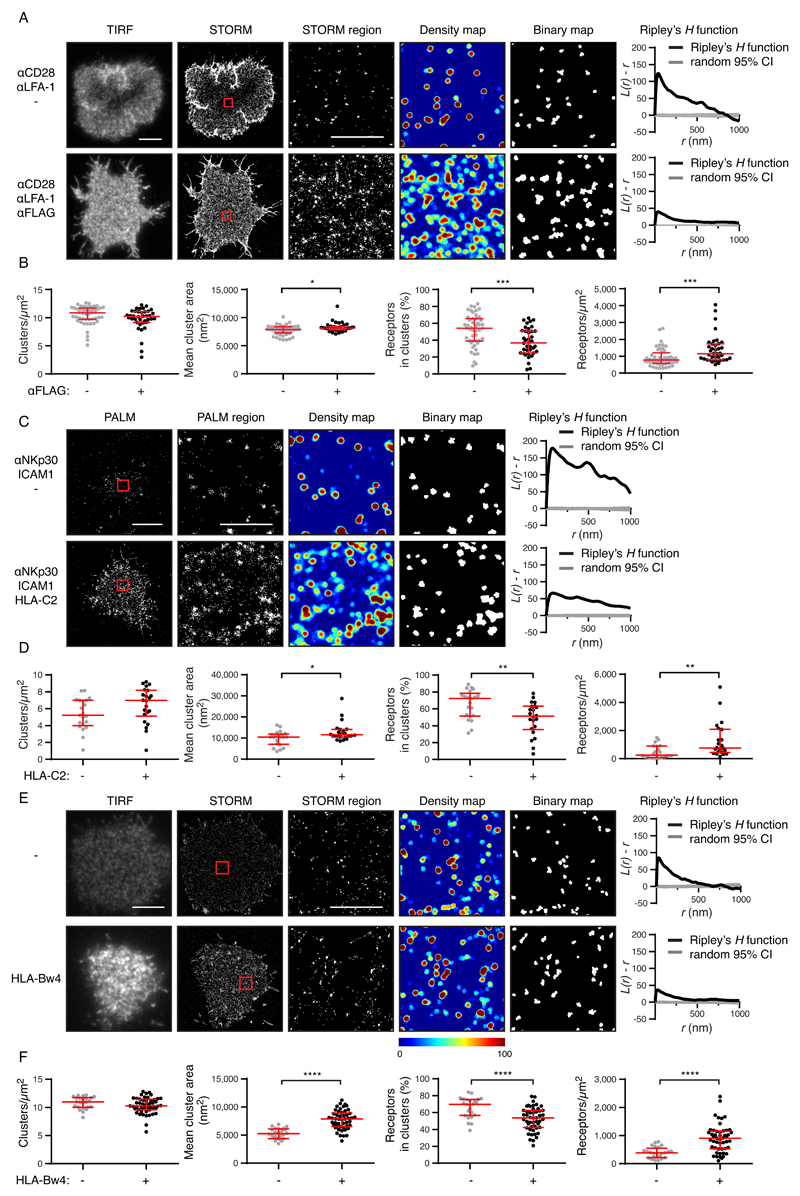
Fig. 5. Ligation reorganizes KIRs.
(A) Representative TIRF microscopy and Gaussian-rendered STORM images of YTS transfectants expressing KIR2DL1-FLAG cells on surfaces coated with mAbs against CD28, LFA-1, and an isotype-matched control antibody (activating conditions) or with mAbs against CD28, LFA-1, and FLAG (inhibitory conditions). (B) Quantitative analysis of the binary maps. Each dot represents the mean value for a cell and the red bars represent the median and IQR. Mann Whitney tests: *P < 0.05, ***P < 0.001. Activation conditions: 48 cells from five experiments; inhibitory conditions (FLAG ligation): 38 cells from five experiments. (C) Representative Gaussian-rendered PALM images of YTS transfectants expressing KIR2DL1-mEos2 on surfaces coated with mAbs against NKp30 and LFA-1, with HLA-C*0401 (“HLA-C2”) or a control protein, BSA. (D) Quantitative analysis of the binary maps depicted in (C). Each dot represents the mean value for a cell and the red bars represent the median and IQR. Mann Whitney tests: *P < 0.05, **P < 0.01. Activation conditions: 21 cells from three experiments; HLA-C2 ligation conditions: 22 cells from three experiments. (E) Representative TIRF microscopy and Gaussian-rendered STORM images of mAb 177407 staining of KIR3DL1+ YTS cells interacting with HLA-B*5701 (“HLA-Bw4”) or control protein, IgG2a. (F) Quantitative analysis of the binary maps of KIR3DL1. No ligation: 24 cells from three experiments; HLA-Bw4 ligation: 49 cells from six experiments. In images of whole cells (scale bars: 5 μm), 2 × 2 μm regions (red boxes) are magnified, and the corresponding scatter plots, density maps, and binary maps are shown alongside (scale bar: 1 μm). In each case, the Ripley’s H function is plotted for a 3 × 3 μm region containing the enlarged region. Each dot represents the mean value for a cell and the red bars represent the median and IQR. Mann Whitney tests: ****P < 0.0001.

