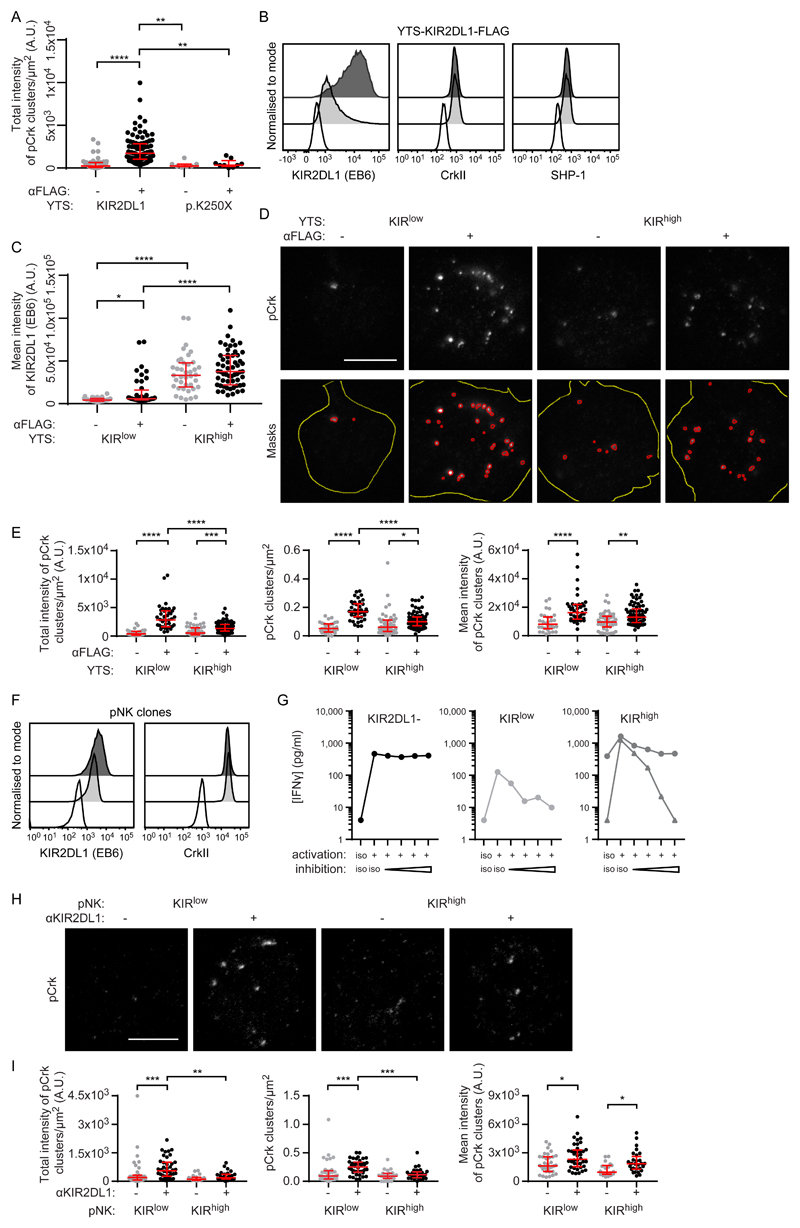
Fig. 6. KIRlow cells generate more pCrk than do KIRhigh cells.
(A to E) KIR2DL1+ YTS cells were ligated with surfaces coated with mAbs against FLAG or an isotype-matched control. (A) Quantification of the intensity of pCrk clusters triggered by the ligation of KIR2DL1 or KIR2DL1-p.K250X as measured by STED microscopy. Kruskal-Wallis test with Dunn’s multiple comparisons: **P < 0.01, ****P < 0.0001. KIR2DL1 no ligation (57 cells, four experiments), KIR2DL1 FLAG ligation (98 cells, four experiments), KIR2DL1 p.K250X no ligation (7 cells, three experiments), KIR2DL1 p.K250X FLAG ligation (9 cells, three experiments). (B) Representative flow cytometry analysis of unstimulated YTS clones that expressed KIR2DL1*003 at high (KIRhigh, dark gray) or low (KIRlow, light gray) amounts stained for surface KIR2DL1, or intracellular CrkII or SHP-1, compared to an isotype-matched control mAb (white). (C to E) Quantification and representative images relating to STED microscopy analysis of KIRlow and KIRhigh cells on surfaces that ligated KIR2DL1. (C) Quantification of KIR2DL1 staining. Kruskal-Wallis test with Dunn’s multiple comparisons: *P < 0.05, ****P < 0.0001. KIRlow no ligation (32 cells, four experiments), KIRlow FLAG ligation (40 cells, four experiments), KIRhigh no ligation (39 cells, three experiments), KIRhigh FLAG ligation (58 cells, three experiments). (D) Representative images of pCrk (scale bar: 5 μm) and outlines of the high-intensity regions of pCrk staining selected for analysis using a custom ImageJ script (masks). Red outlines show the high intensity areas of pCrk staining, whereas yellow outlines show the cell area (from IRM images). (E) Quantitative analysis of pCrk nanoclusters. Kruskal-Wallis test with Dunn’s multiple comparisons: *P < 0.05, **P < 0.01, ***P < 0.001, ****P < 0.0001. KIRlow no ligation (32 cells, four experiments), KIRlow FLAG ligation (40 cells, four experiments), KIRhigh no ligation (48 cells, four experiments), KIRhigh FLAG ligation (74 cells, four experiments). (F) Flow cytometry analysis of representative unstimulated pNK cell clones expressing high (KIRhigh; dark gray) or low (KIRlow; light gray) amounts of KIR2DL1, stained for surface KIR2DL1, intracellular CrkII, or with an isotype-matched control (white). (G) The concentration of IFN-γ in supernatants from pNK clones stimulated with ICAM-1 and a combination of mAbs against activating receptors (NKp30) or inhibitory receptors (KIR2DL1) at a range of concentrations (1, 2, 5, and 7.5 μg/ml), and isotype-matched controls, was measured by ELISA. Graphs are shown for representative clones without KIR2DL1 (left, 1 clone), or expressing low (central, 1 clone) or high (right, 3 clones) amounts of KIR2DL1. Each line represents a different clone. Triplicate measurements were performed. (H) Representative STED microscopy images of pCrk in pNK clones stimulated with coated surfaces (scale bar: 3 μm). (I) Quantitative analysis of pCrk nanoclusters. Each dot represents the mean value for a cell. Red bars represent the median and IQR. Kruskal-Wallis test with Dunn’s multiple comparisons: KIRlow no ligation (35 cells, four experiments), KIRlow KIR ligation (40 cells, four experiments), KIRhigh no ligation (20 cells, three experiments), KIRhigh KIR ligation (28 cells, three experiments). *P < 0.05, **P < 0.01, ***P < 0.001.

