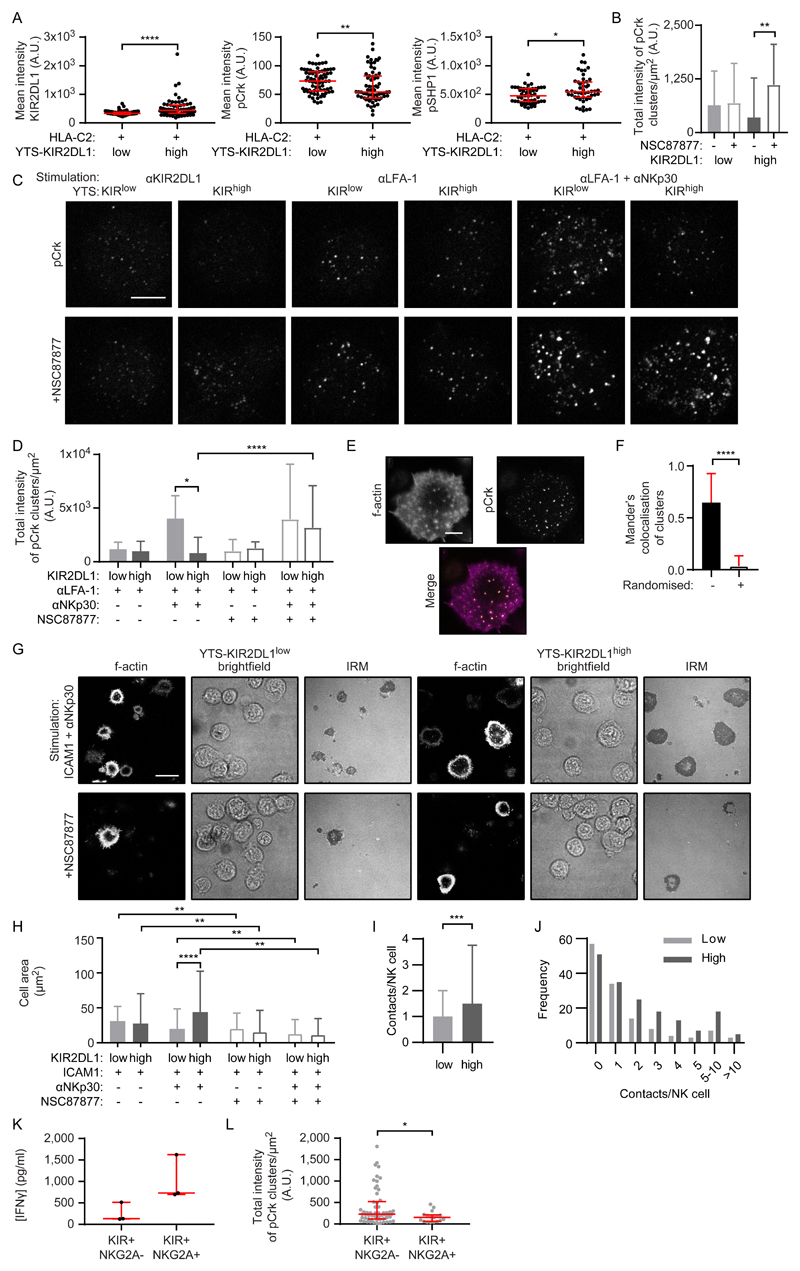
Fig. 7. SHP-1 activity controls Crk phosphorylation and potentiates immune synapse formation.
(A) Mean intensity of KIR2DL1 (FLAG), pCrk, and pSHP-1 in YTS KIRlow and KIRhigh cells ligated with HLA-C*0401 coated onto slides, as measured by confocal microscopy. Each dot represents the mean value for a cell. Mann Whitney test: *P < 0.05, **P < 0.01, ****P < 0.0001. KIRlow KIR2DL1/pCrk (72 cells, three experiments), KIRhigh KIR2DL1/pCrk (66 cells, three experiments), KIRlow pSHP-1 (51 cells, three experiments), KIRlow pSHP-1 (50 cells, three experiments). (B to D) Quantification of pCrk clusters in confocal images of YTS KIRlow and KIRhigh cells on surfaces coated with mAbs against (B) KIR2DL1 or (D) LFA-1 ± NKp30. YTS cells were pretreated with the SHP-1/2 inhibitor NSC87877 (empty) or were untreated (filled). Kruskal-Wallis test with Dunn’s multiple comparisons: *P < 0.05, **P < 0.01, ****P < 0.0001. KIRlow anti-KIR (61 cells, three experiments), KIRlow anti-KIR + NSC87877 (52 cells, three experiments), KIRhigh anti-KIR (50 cells, three experiments), KIRhigh anti-KIR + NSC87877 (47 cells, three experiments), KIRlow anti-LFA-1 (60 cells, three experiments), KIRhigh anti-LFA-1 (60 cells, three experiments), KIRlow anti-LFA-1 anti-NKp30 (59 cells, three experiments), KIRhigh anti-LFA-1 anti-NKp30 (60 cells, three experiments), KIRlow anti-LFA-1 + NSC87877 (57 cells, three experiments), KIRhigh anti-LFA-1 + NSC87877 (60 cells, three experiments), KIRlow anti-LFA-1 anti-NKp30 + NSC87877 (59 cells, three experiments), KIRhigh anti-LFA-1 anti-NKp30 + NSC87877 (58 cells, three experiments). (C) Representative confocal images of pCrk (scale bar: 5μm) relating to (B) and (D). (E) Representative F-actin and pCrk STED microscopy images of a KIR2DL1+ YTS cell on a surface ligating LFA-1 and NKp30 (scale bar: 5μm). (F) Mander’s colocalization of pCrk clusters with the brightest spots of actin, compared to colocalization when the pCrk clusters are artificially placed at random within the cell region of interest. Mann Whitney test: ****P < 0.0001 (38 cells, six experiments). (G) Representative F-actin, brightfield, and IRM images of YTS KIRlow and KIRhigh cells on surfaces coated with ICAM-1 ± mAb against NKp30 ± NSC87877 (scale bar: 20 μm). (H) Quantification of spread cell area from IRM images of the cells represented in (G). Kruskal-Wallis test with Dunn’s multiple comparisons: **P < 0.01, ****P < 0.0001. KIRlow ICAM-1 (731 cells, six experiments), KIRhigh ICAM-1 (711 cells, six experiments), KIRlow ICAM-1 anti-NKp30 (535 cells, six experiments), KIRhigh ICAM-1 anti-NKp30 (547 cells, six experiments), KIRlow ICAM-1 + NSC87877 (246 cells, six experiments), KIRhigh ICAM-1 + NSC87877 (259 cells, six experiments), KIRlow ICAM-1 anti-NKp30 + NSC87877 (390 cells, six experiments), KIRhigh ICAM-1 anti-NKp30 + NSC87877 (459 cells, six experiments). (I and J) Quantification of the number of immune synapses (“contacts”) made by KIRlow and KIRhigh cells with 721.221 cells when suspended in a 3D extracellular matrix and imaged by confocal microscopy for 8 hours. (I) Mean number of synapses made per YTS cell and (J) the number of synapses made by each YTS cell over 8 hours (KIRlow 130 cells, three experiments; KIRhigh, 172 cells, three experiments). Mann Whitney test: **P < 0.01. (K) The amounts of IFN-γ secreted from NKG2A- and NKG2A+ pNK clones stimulated with ICAM-1 and anti-NKp30 mAb were measured by ELISA. Each dot represents a clone. NKG2A- (3 clones, 1 donor), NKG2A+ (3 clones, 1 donor). (L) Quantitative analysis of pCrk nanoclusters in STED microscopy images of NKG2A- and NKG2A+ pNK clones. Each dot represents the mean value for a cell. Mann Whitney test: *P < 0.05. NKG2A- (58 cells, 12 experiments, 1 donor), NKG2A+ (17 cells, three experiments, 1 donor). In all graphs, bars represent the median and IQR.

