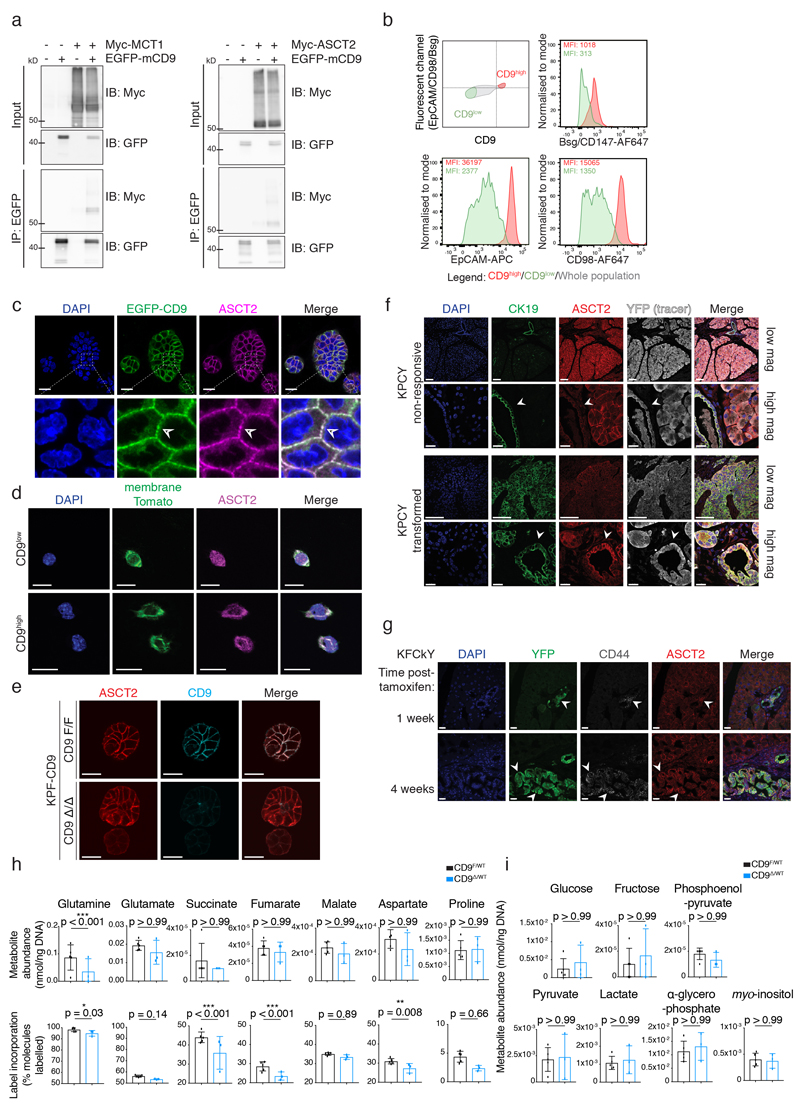
Extended Data Fig. 5. CD9 facilitates glutamine import into TICs.
a) Co-IP of transiently transfected Myc-MCT1 (left) or Myc-mASCT2 (right) with EGFP-mCD9 after EGFP pull-down in HEK293T cells. Blots are representative of 3 independent experiments. See Source Data for uncropped blots.
b) Flow cytometry plots co-staining CD9 with cell surface proteins involved in metabolism in KPC organoids. Representative of 3 independent experiments.
c) Membrane co-localisation (arrowheads) of ASCT2 and EGFP-CD9 in KPC organoids by co-immunofluorescence. Scale bar, 20 μm; insert 20 by 20 μm.
d) Immunofluorescence of ASCT on sorted CD9low and CD9high KPC cells. Scale bars, 20 μm. Representative of 3 independent experiments.
e) Immunofluorescence of KPF-CD9 organoids after control vehicle or 4-OHT treatment. Representative of 2 independent experiments. Scale bars, 20 μm. Related to Fig. 5e.
f) Immunofluorescence of ASCT2 in a KPCY mouse pancreas: non-transformed area (top) and transformed areas (bottom). Scale bars, 100 μm low mag, 20 μm high mag. Representative of at least 3 biologically independent animals.
g) YFP, CD44, ASCT2 and DAPI staining on pancreatic tissue of a KFCkY mice 1 week (top) and 4 weeks (bottom) post-tamoxifen. Scale bars, 20 μm. Representative of at least 3 biologically independent animals.
h) Metabolic profiles of KPF-CD9 organoids (after control Adeno-EGFP (CD9F/WT) or Adeno-CRE-EGFP (CD9Δ/WT) infection) grown in organoid media containing 4 mM 13C-glutamine for 4 h.
i) Some metabolites, including glycolytic intermediates, are equally abundant under the conditions in (h), but did not contain any detectable 13C label. Data in (h) and (i) represent one experiment carried out with six technical replicates. Due to technical limitations, statistics for metabolite abundance and label incorporation were performed on technical replicates separately using a two-way ANOVA corrected for multiple comparisons using the Holm-Sidak method, α = 0.05; bar charts show mean, s.d.

