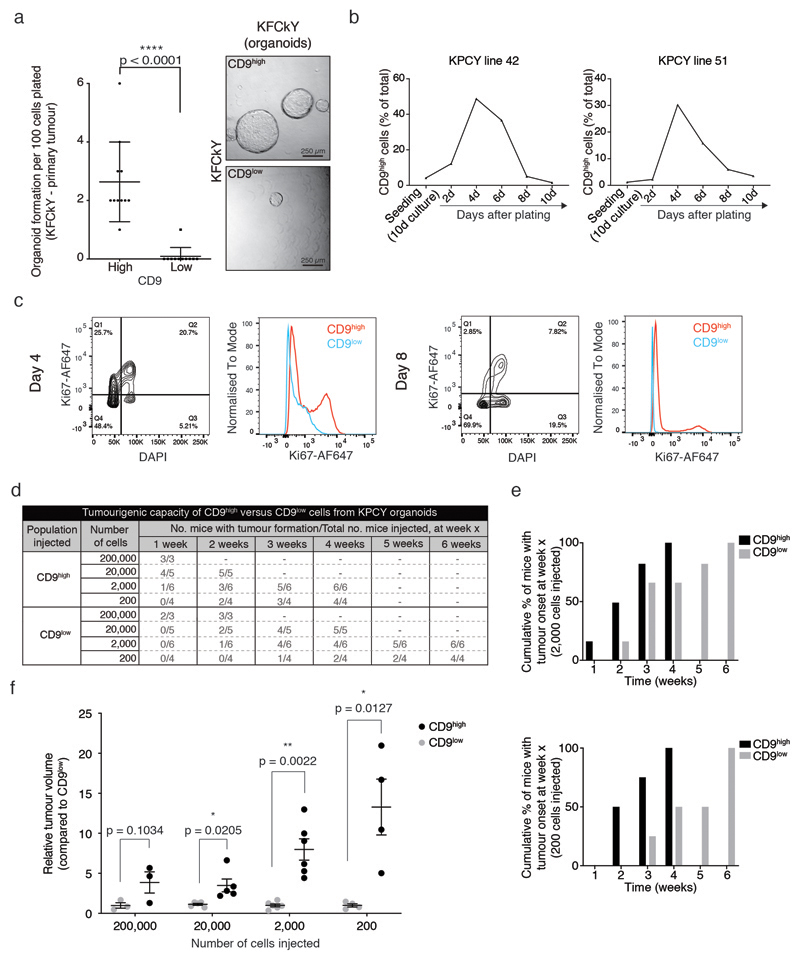
Extended Data Fig. 2. CD9 marks TICs.
a) Organoid formation assay (organoid number) of CD9high and CD9low YFP+ tumour cells freshly isolated from KFCkY PDAC (n = 4 biologically independent animals). Dot plot shows mean, s.d., p value from two-sided Mann-Whitney test. Right, representative brightfield images of generated organoids 10 days after plating. Scale bar, 250 μm.
b) CD9 expression dynamics of two representative KPCY organoid cultures. Organoid cultures were dissociated at confluency and replated. The percentage of CD9high cells was measured by flow cytometry over time as the cultures grew.
c) Flow cytometry analysis of a representative KPCY organoid culture at 4 and 8 days of culture, stained for CD9 and the proliferation marker Ki67. Proliferation is higher at 4 than 8 days, and only CD9high cells actively proliferate in the culture at both timepoints. Flow cytometry plots shown in (b) and (c) are representative of at least three biologically independent samples.
d) Tumourigenic capacity of CD9high versus CD9low tumour cells from KPCY PDAC-derived organoids. 200,000, 20,000, 2,000 or 200 sorted tumour cells were injected into the flanks of Nu/Nu mice and the number of weeks to nodule detection (4 mm3) was registered.
e) Bar charts of percentage of mice injected with 2,000 (above) or 200 (below) sorted CD9high or CD9low tumour cells that developed tumours by the given week. Each bar shows cumulative data of all mice harbouring tumours at a given week (n = 6 for 2,000 cells, n = 4 for 200 cells).
f) Fold difference in tumour volumes between the CD9low- and CD9high-derived tumours at each dilution; n = 3, 5, 6 and 4 biologically independent animals for 200,000-, 20,000-, 2,000- and 200-cell injections, respectively. Dot plot shows mean, s.d., p values from two-sided t tests.

