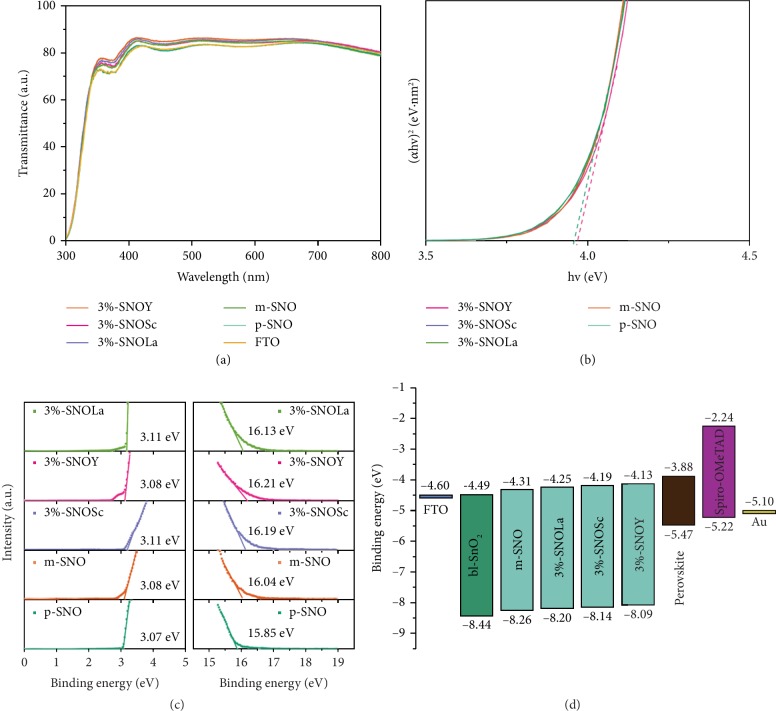
Figure 4.
(a) Transmittance spectra of films. (b) Tauc plots corresponding to the transmission spectra. (c) Ultraviolet photoelectron spectroscopy (UPS) spectra of films in the on-set (left) and the cutoff (right) region. (d) Experimentally determined energy level diagrams (relative to the vacuum level) of different component layers in the PSC devices.

