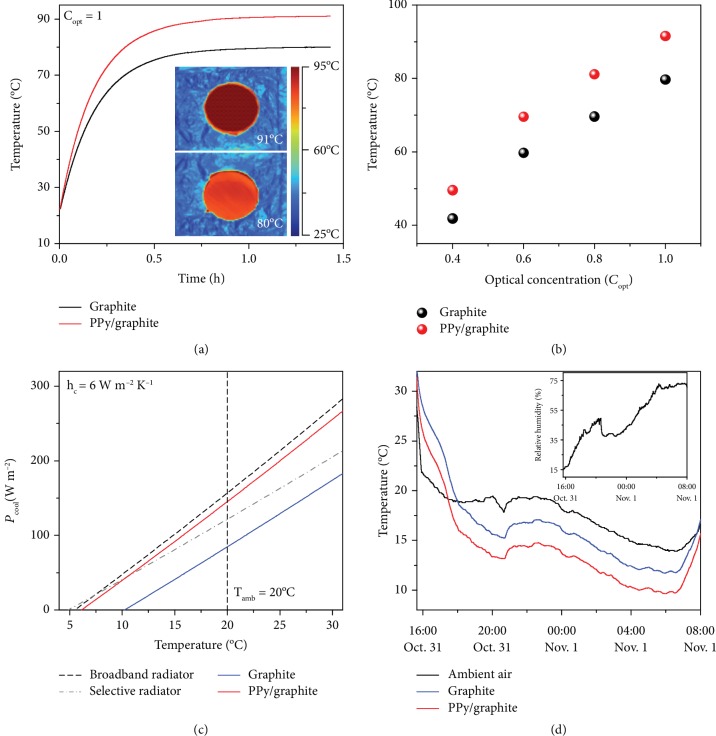
Figure 3.
Performances of heating and cooling. (a) Increasing temperature curves of PPy/graphite and graphite under illumination with Copt = 1. The insets show the corresponding infrared (IR) thermal images at a steady state. (b) Steady-state temperature of PPy/graphite and graphite under different optical concentrations. (c) Net cooling power Pcool versus radiator temperature for PPy/graphite, graphite, a broadband radiator, and a selective radiator simulated by considering a nonradiative heat coefficient (hc) of 6 W m−2 K−1 [43]. (d) A 16-hour continuous temperature measurement of PPy/graphite, graphite, and ambient air from 16:00 (October 31, 2018) to 8:00 (November 1, 2018) at the Wuhan National Laboratory for Optoelectronics (WNLO), China (30°30′49′′ N, 114°25′13′′ E, 35 m altitude). The inset shows the ambient relative humidity fluctuation.

