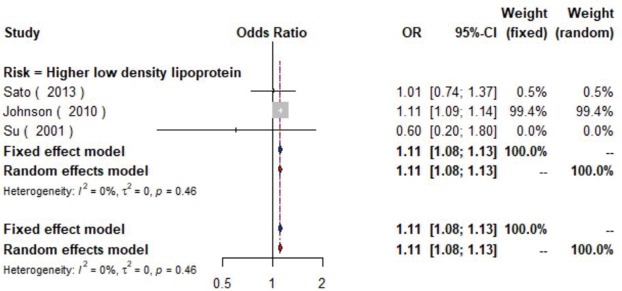
Figure S6.
The forest plot shows the relationship between higher low density lipoprotein and the presence of carotid plaque. Each comparison is presented by the name of the first author and the year of publication. The contrast has an OR of 1.11 (95% CI: 1.08–1.13, P=0.46) in the random effects model. Values more than 1 denote an increased risk for the presence of carotid plaque with higher low-density lipoprotein. CI, confidence interval; OR, odds ratio.

