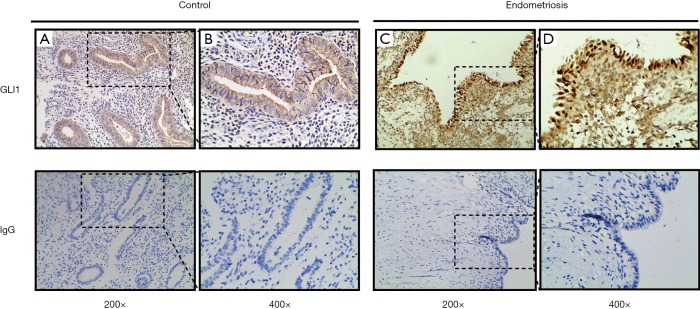
Figure 1.
Glioma associated oncogene 1 (GLI1) localization and expression in different groups of endometrium. Representative images of immunohistochemical analysis of GLI1 in normal endometrium (A,B) and ectopic endometrium (C,D). Normal IgG is used as negative control. Photographs were taken at magnifications of 200× (left panels) and 400× (right panels) respectively.

