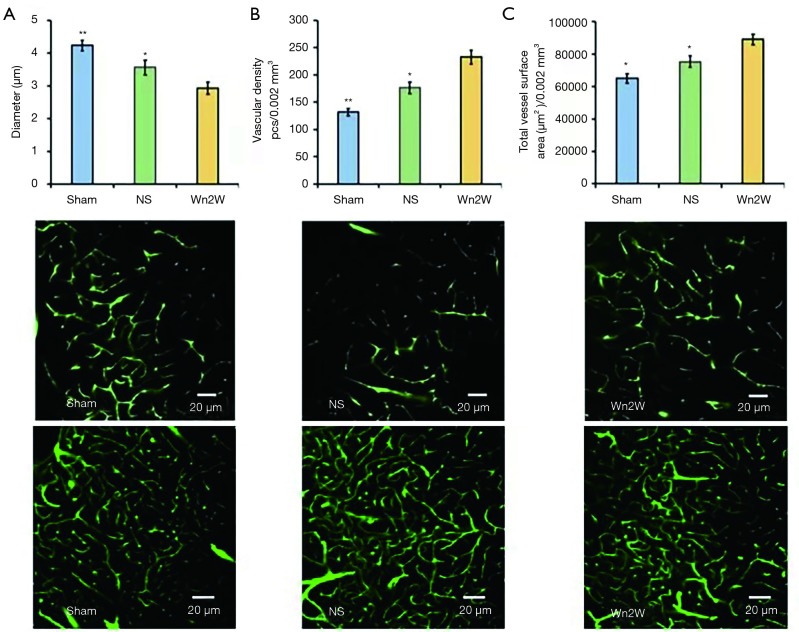
Figure 2.
Three-dimensional confocal analysis of rat brain tissue after 14 days. (A) The differences of the vascular diameter of the Wn2W group, Sham group, and NS group; (B) the differences of the vascular density of the Wn2W group, Sham group, and NS group; (C) the differences of the total microvessel area of the Wn2W group, Sham group, and NS group. *, P<0.05 Wn2W group versus Sham or NS group; **, P<0.01 Wn2W group versus Sham or NS group.

