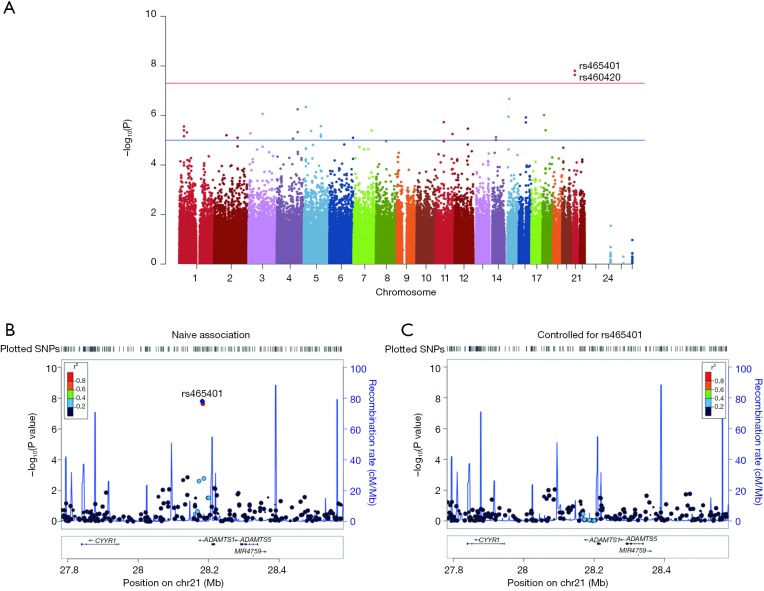
Figure 1.
Association plots from single variant analyses of CSF NFL levels. (A) Manhattan plot shows the significance of association between each SNP and CSF NFL levels, from GWAS. Observed log10 P values (y-axis) are displayed for all tested SNPs on each autosomal chromosome (x-axis). The horizontal line indicates the p value thresholds: blue line for P=5×10⁻⁸, and red line for P=1×10⁻⁵. (B,C) Regional visualization of the results for the most associated SNP (rs465401). Symbols are colored according to the degree of linkage disequilibrium with rs465401. The location of genes is represented below the plots. CSF, cerebrospinal fluid; NFL, neurofilament light; SNP, single nucleotide polymorphism; GWAS, genome-wide association study.

