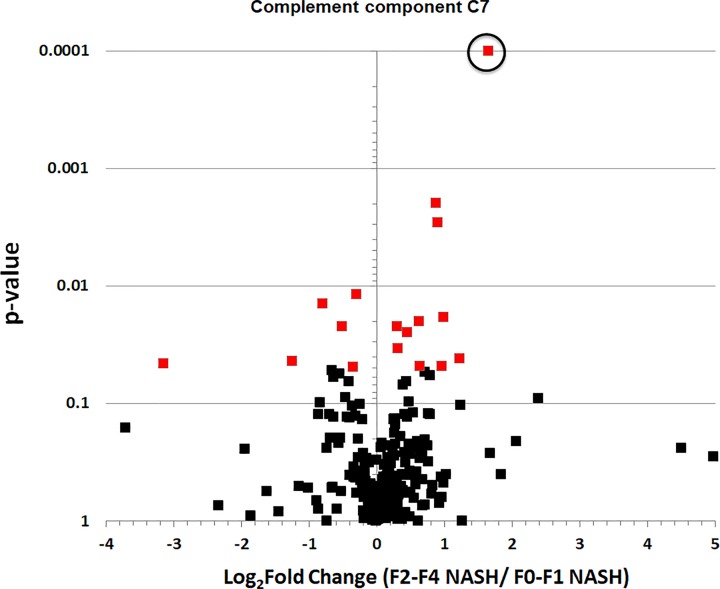
Figure 2. The volcano plot of all proteins identified in the Progenesis Qi analysis.
Complement C7 was circled above and was three-fold higher (log2 = 1.65) in the NASH group with significant/advanced fibrosis (F2–F4) compared with the early NASH (F0-F1) group (actual q-value = 3.6E-6, but was changed to 0.0001 for display purposes).

