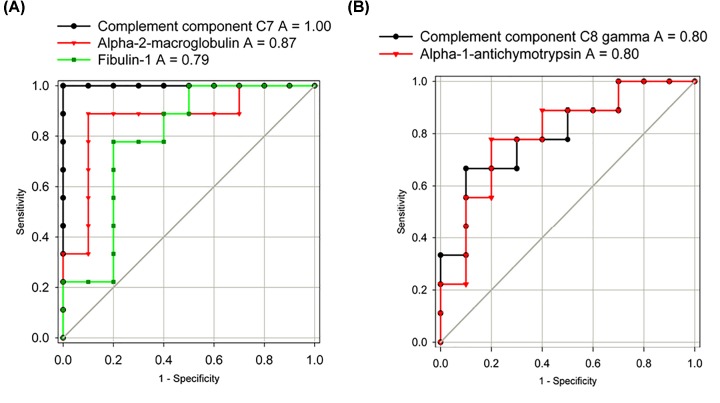
Figure 3. Classification performance estimated using ROC curve for the five consensus differential plasma proteins.
(A) Proteins elevated in the NASH patients with significant/advanced fibrosis (F2–F4). (B) Proteins lower in the NASH patients with significant/advanced fibrosis (F2–F4). Abbreviation: AUC, area under the curve. All areas have a P-value <0.03.

