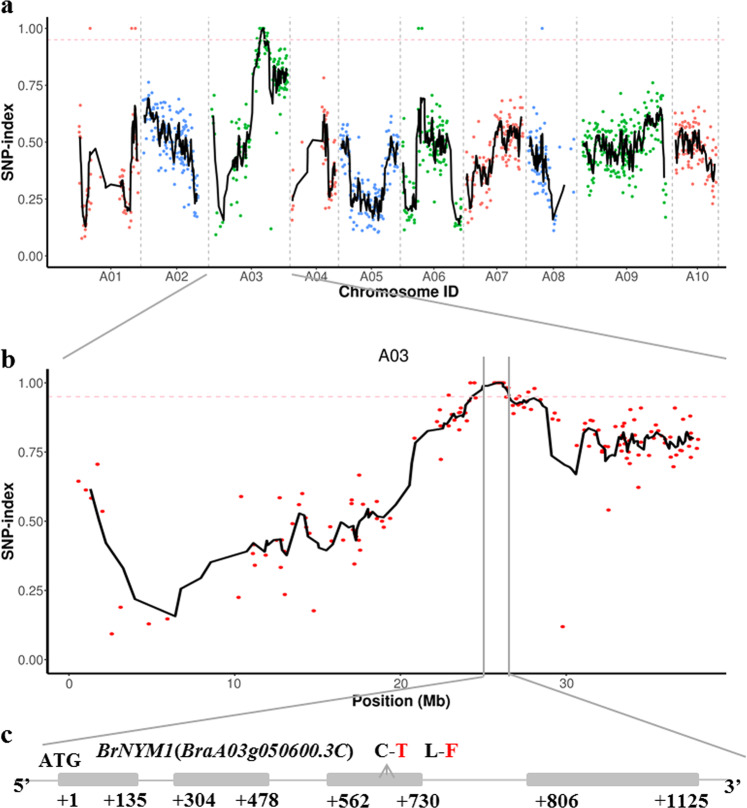
Fig. 2. SNP index plot from MutMap and gene structure of BrNYM1.
a SNP index of ten chromosomes plotted by MutMap sliding window analysis. The x-axis represents the positions of ten chromosomes. The y-axis represents the SNP index. The dotted pink line is the index (0.95) threshold line. Black lines were created by averaging SNP indices from a moving window spanning five consecutive SNPs and moving window one SNP at a time. b SNP index plot from MutMap identifying the candidate region on chromosome A03. Black and dotted pink lines are described above. c Candidate genes in the mapping region. Gray boxes and arrows represent genes and mutation sites, respectively. Sequence analysis revealed one SNP (C in wild-type; T in mutant) in the third exon resulting in an amino acid mutation (L in wild type; F in mutant).

