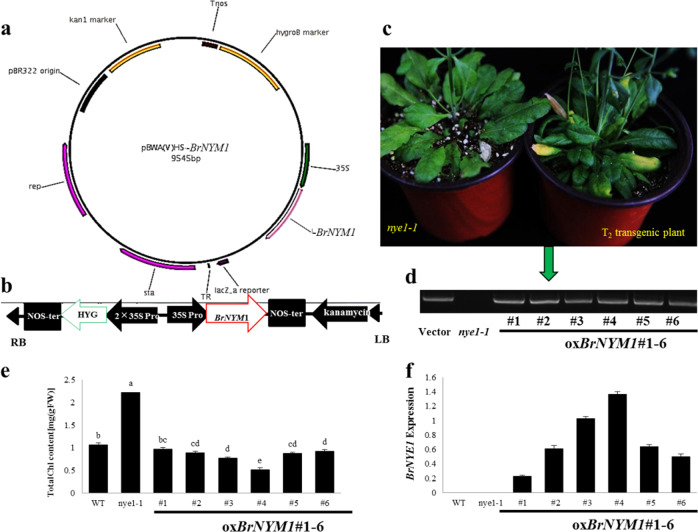
Fig. 3. Transformation and phenotype of transgenic Arabidopsis thaliana plants transformed with 35SBrNYM1.
a Binary vector map of pBWA(V)BS–BrNYM1. b Diagram of components in the binary vector pBWA(V)BS–BrNYE1. RB right border, LB left border, NOS-pro nopaline synthase promoter, NOS-ter nopaline synthase terminator, HYG hygromycin, 35S-pro CaMV 35S promoter. c Morphology of representative T2 transgenic A. thaliana plants and stay-green mutant nye1-1. Left: nye1-1 with stay-green leaves; right: T2 transgenic plants with yellow phenotype. Plants 40 DAS. d PCR-based DNA genotyping of transgenic plants (1–6) with primers 35S_P and BrNYM1. e Quantitative comparison of the total chlorophyll content in senescent leaves of Col-0, nye1-1, and transgenic plants (1–6) DPS v. 7.05 was used for variance analysis. Data were analyzed by Duncan’s multiple range test (DMRT). Different lowercase letters indicate significant differences (n = 3; P < 0.05). f Analysis of BrNYM1 expression in Col-0, nye1-1, and transgenic plants (1–6).

