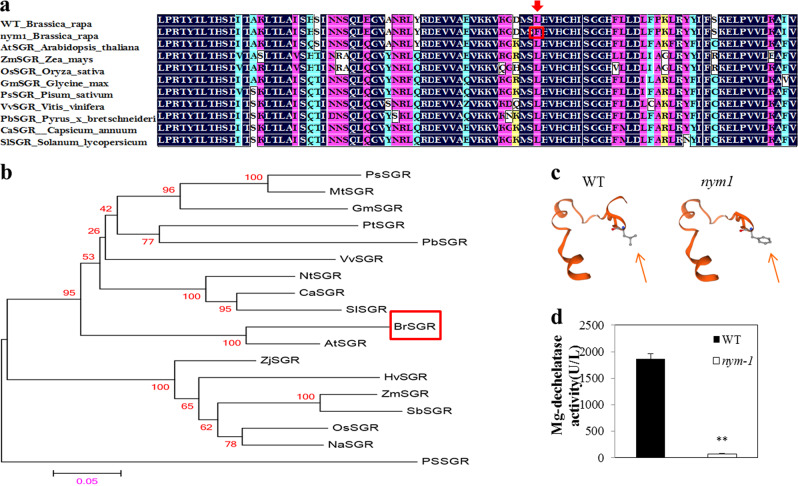
Fig. 4. Partial sequence alignment and phylogenetic tree of BrNYM1.
a SGR sequence alignment. Residues with 100% similarity are shaded in black. Those with ≥75% similarity are shaded in pink. Those with ≥50% similarity are shaded in blue. Those with ≥33% similarity are shaded in yellow. The SGR protein accession numbers are as follows: Pisum sativum, PsSGR (CAP04954); Medicago truncatula, MtSGR (AEE00201); Glycine max, GmSGR (AAW82959); Populus trichocarpa, PtSGR (EEE79433); Pyrus×bretschneideri, PbSGR (AEO19901); Vitis vinifera, VvSGR (AM455317); Nicotiana tabacum, NtSGR (ABY19382); Capsicum annuum, CaSGR (ACB56586); Solanum lycopersicon, SlSGR (ACB56587); Arabidopsis thaliana, AtSGR (AAW82962), Zoysia japonica, ZjSGR (AAW82961), Hordeum vulgare, HvSGR (AAW82955); Zea mays, ZmSGR (AAW82956); Sorghum bicolor, SbSGR (AAW82958); Oryza sativa, OsSGR (AAW82954); Neosinocalamus affinis, NaSGR (ADK56113); and Picea sitchensis, PSSGR (ABK22344). b Phylogenetic analysis of SGRs. c Partial 3D structure of BrNYM1 in wild type (left) and mutant (right). Amino acid sequences include SNPs. The red arrow represents different amino acid conformations at the mutant site. d Mg-dechelatase activity in “FT” and nym1 during leaf senescence. The plant stage and sampling method were the same as those in Fig. 1c. Data were analyzed by a two-tailed t test. Significant differences were marked with an asterisk (P < 0.01). U/L = activity unit.

