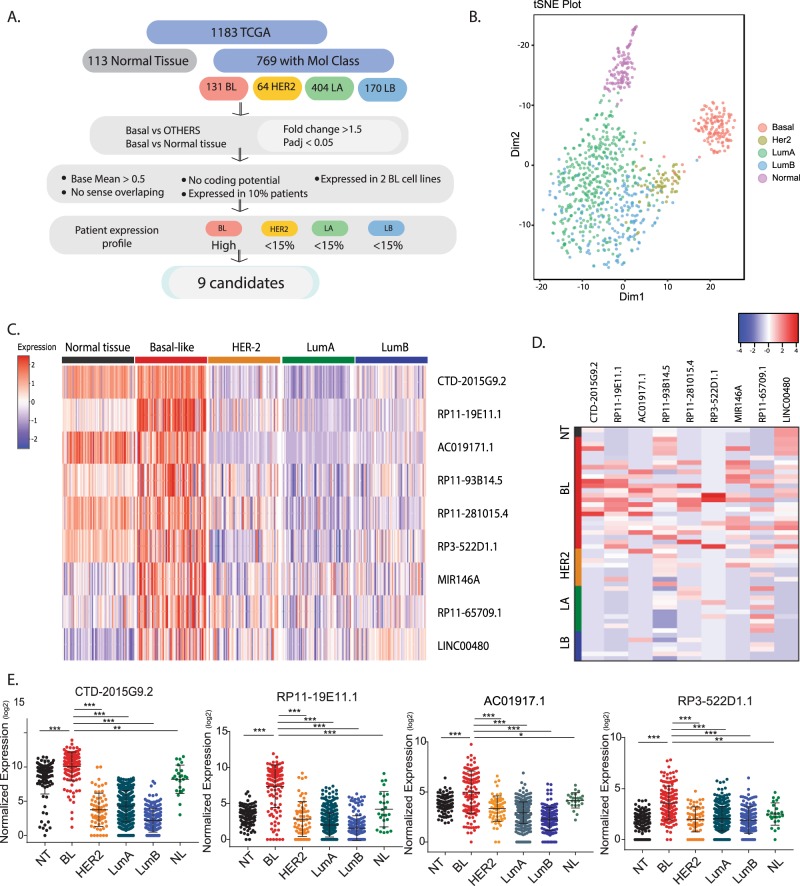
Fig. 1. Identification of lncRNAs specific for the basal-like breast cancer subtype using patient data from the TCGA database.
a Pipeline flow chart used to identify lncRNA candidates. b t-SNE plot originated from the expression of the 500 top-expressed lncRNA in patients. c Heatmap showing the expression of the nine lncRNA candidates in different breast cancer subtypes. d Heatmap showing the expression of the nine candidates in a panel of cell lines classified according to their molecular subtype. e Dot plot showing the levels of expression for each patient within the breast cancer subtypes for the lncRNA candidates selected. Mean ± SD are represented for each condition. *P < 0.05; **p < 0.01; ***p < 0.001 (ANOVA). NT normal tissue, BL basal-like, HER2 her2-enriched, LA luminal A, LB luminal B, NL normal-like.

