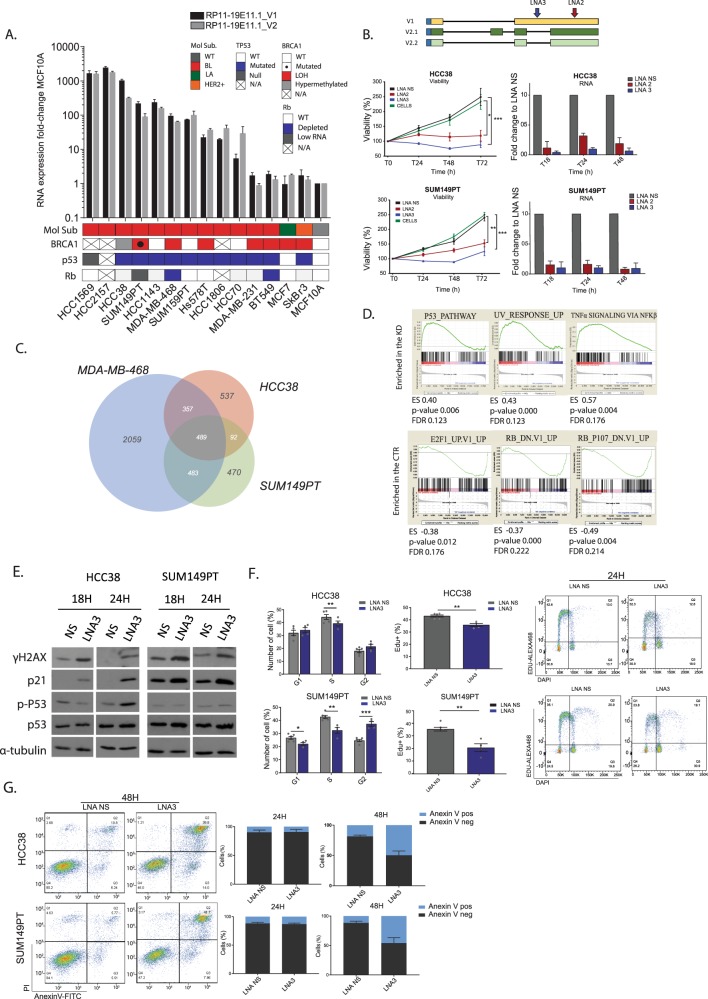
Fig. 5. Functional characterization of lncRNA RP11-19E11.1.
a RNA levels of both V1 and V2 assessed by qRT-PCR in a panel of basal-like cell lines. MCF10A was used as a reference. b Viability assay (MTT) in HCC38 and SUM149PT cell lines using two different LNAs with distinct target sites (LNA2/LNA3 25 nM). c Venn diagram of genes commonly deregulated (fold-change >2, false discovery rate (FDR) <0.1) in the three cell lines after 24 h of knock-down (LNA1 + LNA2 50 nM). d GSEA enrichment results for hallmark and oncogenic pathways after the knock-down of lncRNA RP11-19E11.1. e Protein analysis by WB of γH2AX, P53, p-P53, and p21 after 18 and 24 h after LNA3 transfection (25 nM). f Cell cycle analysis and EdU incorporation analysis (PI-EdU double staining) at 24 h after LNA3 transfection (25 nM) in HCC38 and SUM149PT cell lines. Each point represents a single measurement. g Annexin-V analysis after 24 and 48 h after LNA3 transfection (25 nM) in HCC38 and SUM149PT cell lines. Experiments were performed at least three times in triplicate. Data are presented as mean ± SEM. *P < 0.05; **p < 0.01; ***p < 0.001 (two-tailed unpaired t test).

