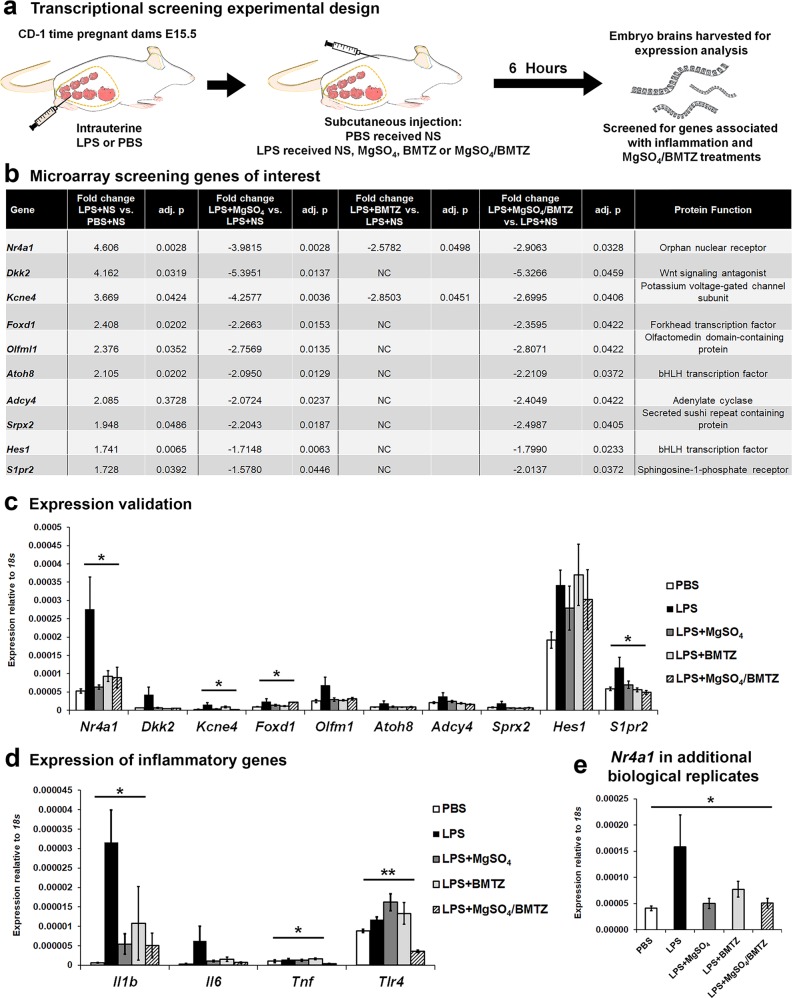
Fig. 1. Screening for inflammatory regulators reveals the upregulation of Nr4a1.
a CD-1 dams were randomized to receive an intrauterine injection of LPS or PBS at E15.5. Dams given LPS were randomized to receive subcutaneous injections of a combination of MgSO4 and/or BMTZ or the normal saline (NS) vehicle control. Mice that received PBS received NS. Brains were harvested for gene expression analysis 6 h following intrauterine injections. b The top genes upregulated with LPS and downregulated with treatment. Fold changes represent genes upregulated with LPS+NS groups vs. PBS+NS controls (column 2) and downregulated in LPS groups with MgSO4 (column 4), BMTZ (column 6), or the combination of MgSO4/BMTZ (column 8). Column 10 denotes a description of each gene. NC denotes no change. This comparison represents N = 4 embryo brains per condition, analyzed by microarray. c Validation by qRT-PCR in the same samples used for microarray analysis in b. d Expression of key inflammatory genes (Il1b, Il6, Tnf and Tlr4) by qRT-PCR, in the same samples assayed in b. e Additional embryo brains (total N = 8–9 per group) analyzed by qRT-PCR to confirm the upregulation of Nr4a1. *p < 0.05 and **p < 0.005 by one-way ANOVA. Error bars represent ±SEM.

