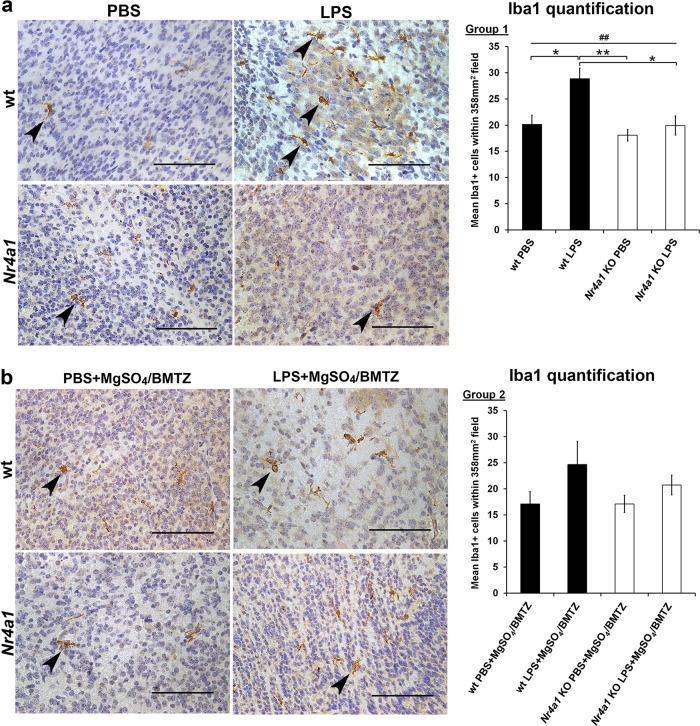
Fig. 3. Microglial comparison between wt and Nr4a1 KO embryos.
E.15.5 brains from wt and Nr4a1 KO embryos were stained for Iba1 with DAB (brown). Sections were counterstained with hematoxylin to visualize nuclei in blue and high magnification micrographs (40×) depict Iba1+ microglia (arrowheads) between conditions. Cell quantifications graphed to the right were conducted at a lower magnification (20×) in order to reduce error. a Comparison and quantification of Iba1+ cells for group 1 (N = 6 brains per condition); wt and Nr4a1 KO animals were exposed to PBS or LPS. b Comparison and quantification for group 2 (N = 3 brains per condition); wt and Nr4a1 KO animals were exposed to PBS or LPS and MgSO4/BMTZ treatment. Scale bars denote 100 µm. ##p < 0.005 by one-way ANOVA and *p < 0.05, **p < 0.005, by Tukey’s post-hoc test. Error bars represent ± SEM.

