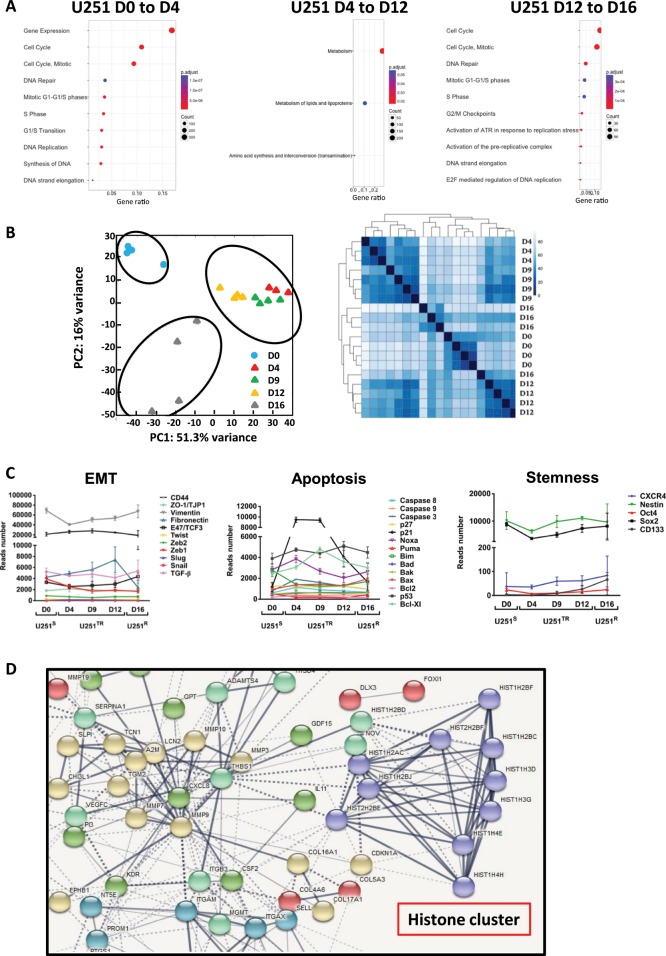
Fig. 3. RNAseq analysis.
a Reactome over-representation tests: pathways highlighted in three main evolutions during TMZ treatment of U251S. Gene ratio: proportion of mapped genes to each pathway. Count: number of genes. b Principal component analysis (PCA) (left), heatmap resulting from the transcriptome analysis of U251 after 0, 4, 9, 12, 16 days treatment with 50 µM TMZ (right). c Number of reads during acquisition of resistance for genes belonging to the apoptotic, EMT, and stemness families. d Functional protein association networks (STRING analysis) of genes over-expressed during the transient state (fold change > log2).

