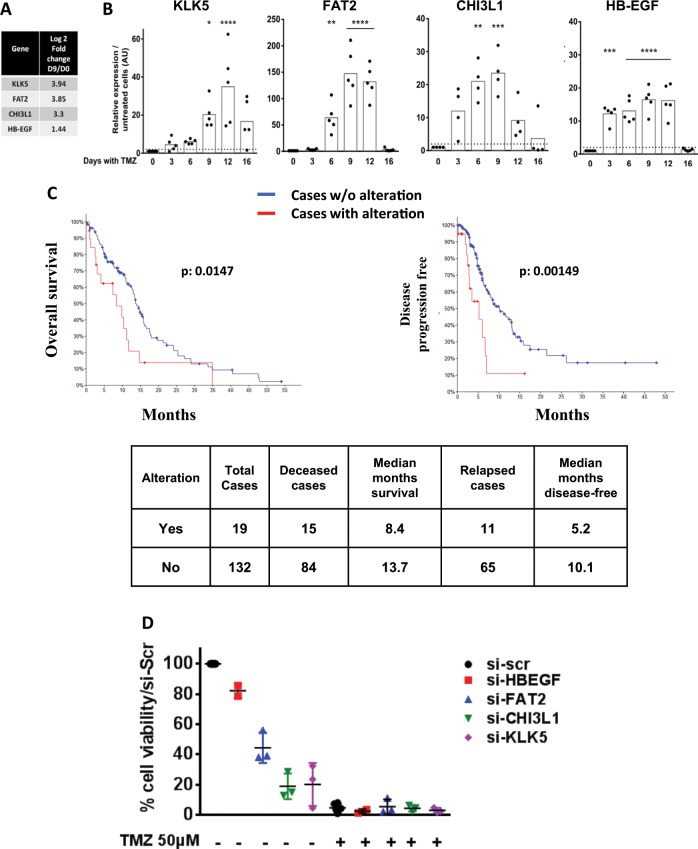
Fig. 4. Markers of the transient phase.
a Relative expression of the four selected markers at D9 in the RNAseq study. b Time course of KLK5, FAT2, CHI3L1 and HB-EGF by RT-qPCR in U251 cells treated with 50 µM TMZ every 3 days. Dotted line: fold change = 2. c TCGA glioblastoma database analysis for KLK5, FAT2, CHI3L1, and HB-EGF expression (RNAseq profile with a score threshold +/−2): Kaplan–Meier estimate of overall survival (left), and disease/progression-free (right). d Cell viability of U251 cells treated with siRNA directed against the respective genes and treated or not with TMZ 50 µM as detailed in Methods. Cells were collected and counted on day 7.

