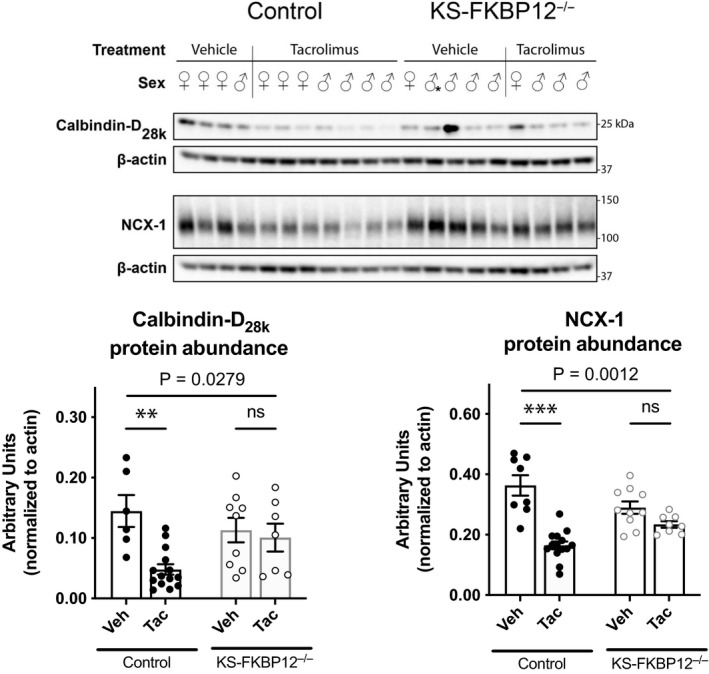
Figure 3.

Effect of tacrolimus treatment on calbindin‐D28K and Na/Ca exchanger protein abundance. (Top panel) Western blot of NCX‐1 and calbindin‐D28K in KS‐FKBP12−/− or control mice treated with vehicle or tacrolimus. (Bottom left) Quantification of calbindin‐D28K protein. (Bottom right) Quantification of NCX‐1 protein. Statistical comparison with two‐way ANOVA followed by Tukey multiple comparison procedure. Exact p values indicate the significance of the interaction between treatment and strain. **p < .01, ***p < .001
