
Figure 5.
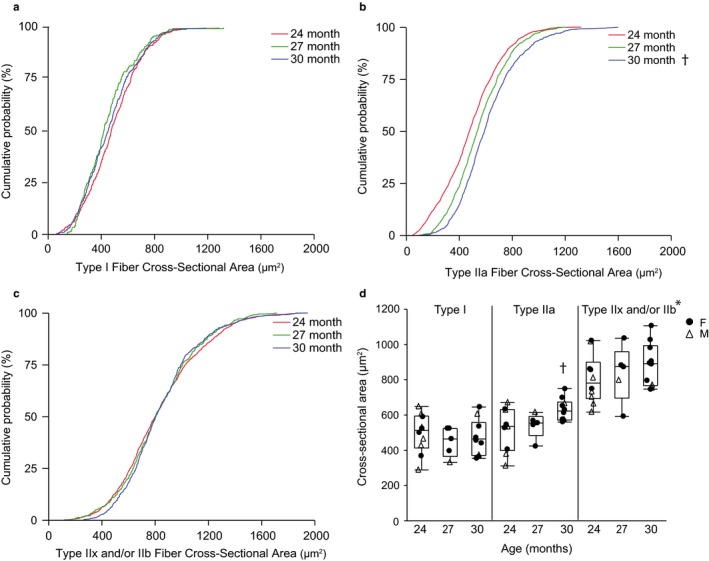
Diaphragm muscle fiber cross‐sectional area at type‐identified fibers in 24 (n = 10), 27 (n = 5), and 30 (n = 10) month old female (F; closed circle) and male (M; open triangle) C57BL/6 × 129 mice. Cumulative distribution function plots for type I fibers (a), type IIa fibers (b), type IIx and/or IIb fibers (c) and average of mean cross‐sectional area for each fiber type per animal (d). Boxplot represents median, 25th and 75th percentile and whiskers 10th and 90th percentiles. Data were analyzed with a mixed linear model with animal as a random effect (age × fiber type × animal). Main effect of fiber type (p < .01), age × fiber type interaction (p < .01), but no effect of age (p = .33). *Type IIx and/or IIb fibers CSA significantly greater than that of type I or IIa fibers across all age groups, †Type IIa CSA significantly greater at 30 mo than 24 mo