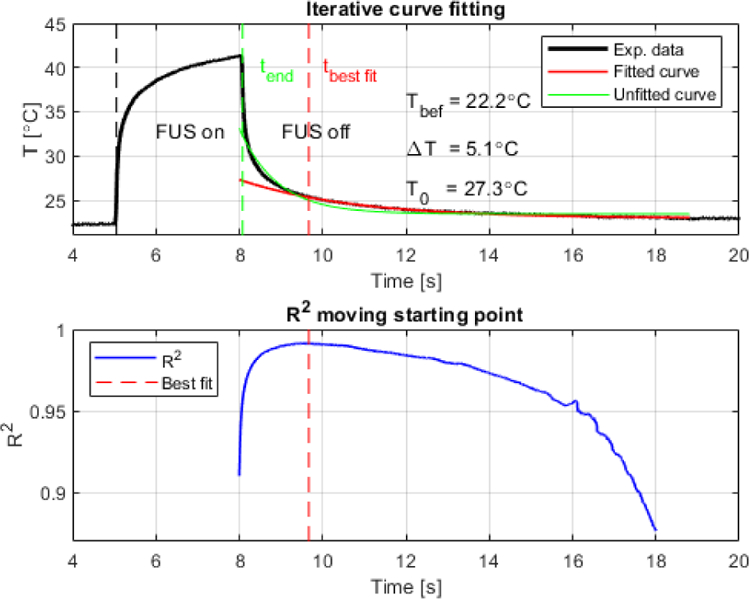
Fig. 3.

Representative plots of iterative curve fitting process during cooling from acquisition using wire thermocouple in excised canine liver (3.1 MHz, −1.3 MPa, 3 s, CW). (Top) Original experimental data and best fitted curve indicating the retrieved peak temperature at the end of sonication (T0) equal to 27.3°C, resulting in a total temperature variation of 5.1°C during 3 s sonication (temperature before sonication Tbef was equal to 22.2°C). A fit curve from t=8 s (green) is also provided to demonstrate the lowest R2. (Bottom) Full goodness of fit profile indicated by R2 showing in dashed red line when the artifact was minimum (9.7 s).
