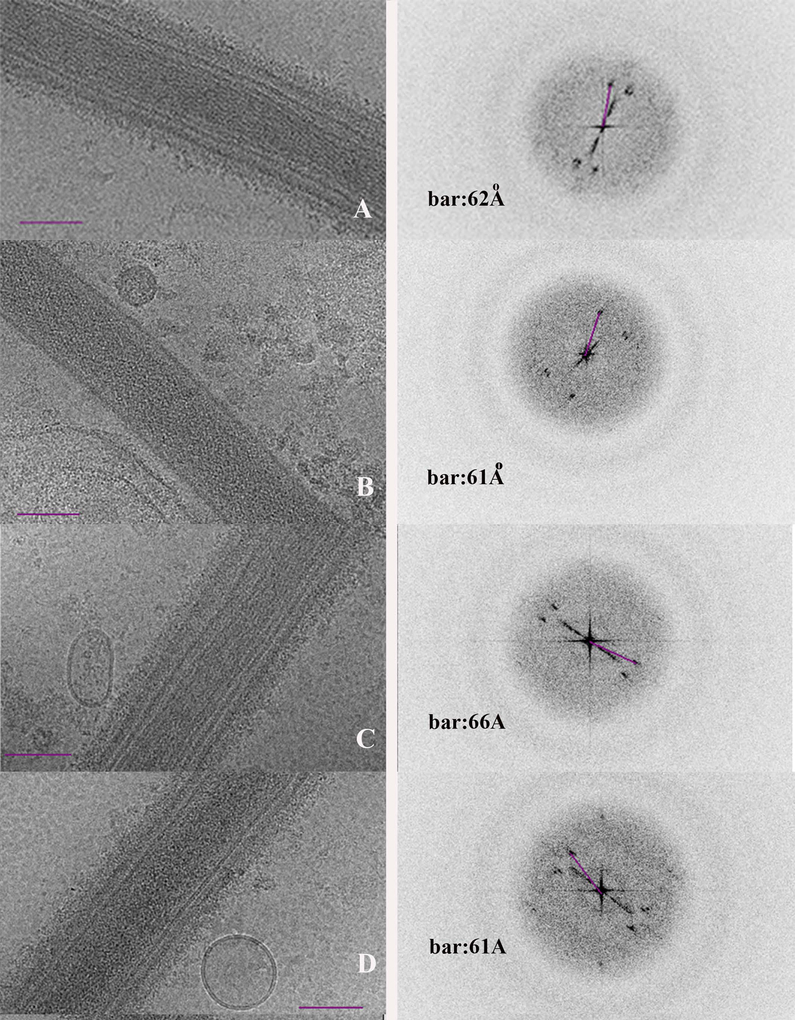
Figure 4.
CTEM polar tube images and their diffraction patterns.
A- D. Four CTEM images representative of the 100 plus samples of PTs and their accompanying diffraction patterns. The calculated Fourier transform of each image’s measured diffraction spot distances are noted on the diffraction image accompanying the CTEM image. Bar is 100nm.

