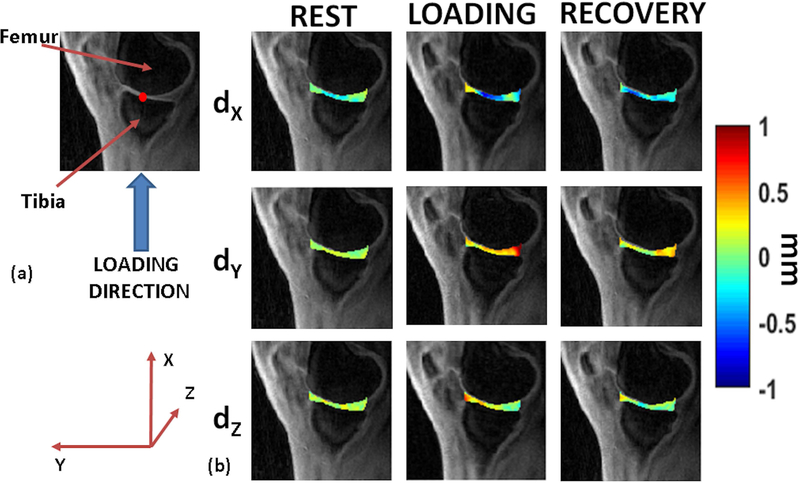
Figure 3.
Motion deformation maps. (a) shows the direction of static loading targeted to the tibiofemoral articular cartilage. The figure also serves as the anatomical reference for (b), with red dot the assumed point of contact (b) shows example deformation maps in the articular cartilage showing displacement (dX, dY, and dZ) for the rest, loading and recovery phases.

