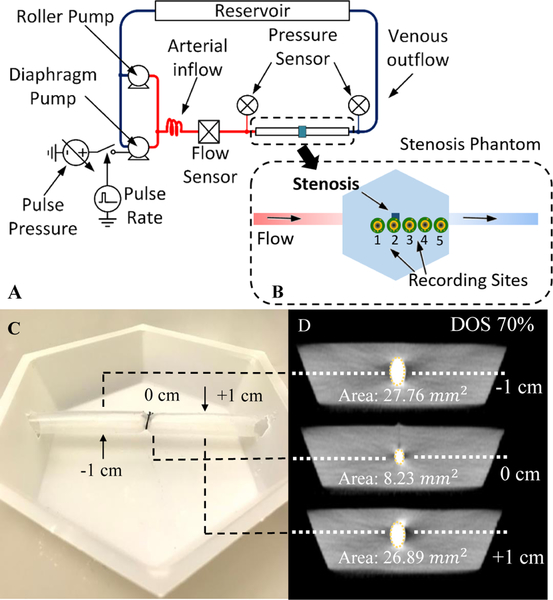
Fig. 11.
(A) Vascular stenosis phantom flow diagram. Two pumping systems produced pulsatile flows in a vascular access phantom within physiological ranges of flow and pressure. The recording sites are shown in the stenosis phantom diagram (B). 10–85% stenosis is simulated in the center of phantom by tying the band around 6-mm silicone tubing (C). Computed CT Slices validates degree of stenosis (DOS) in the phantom (D).

