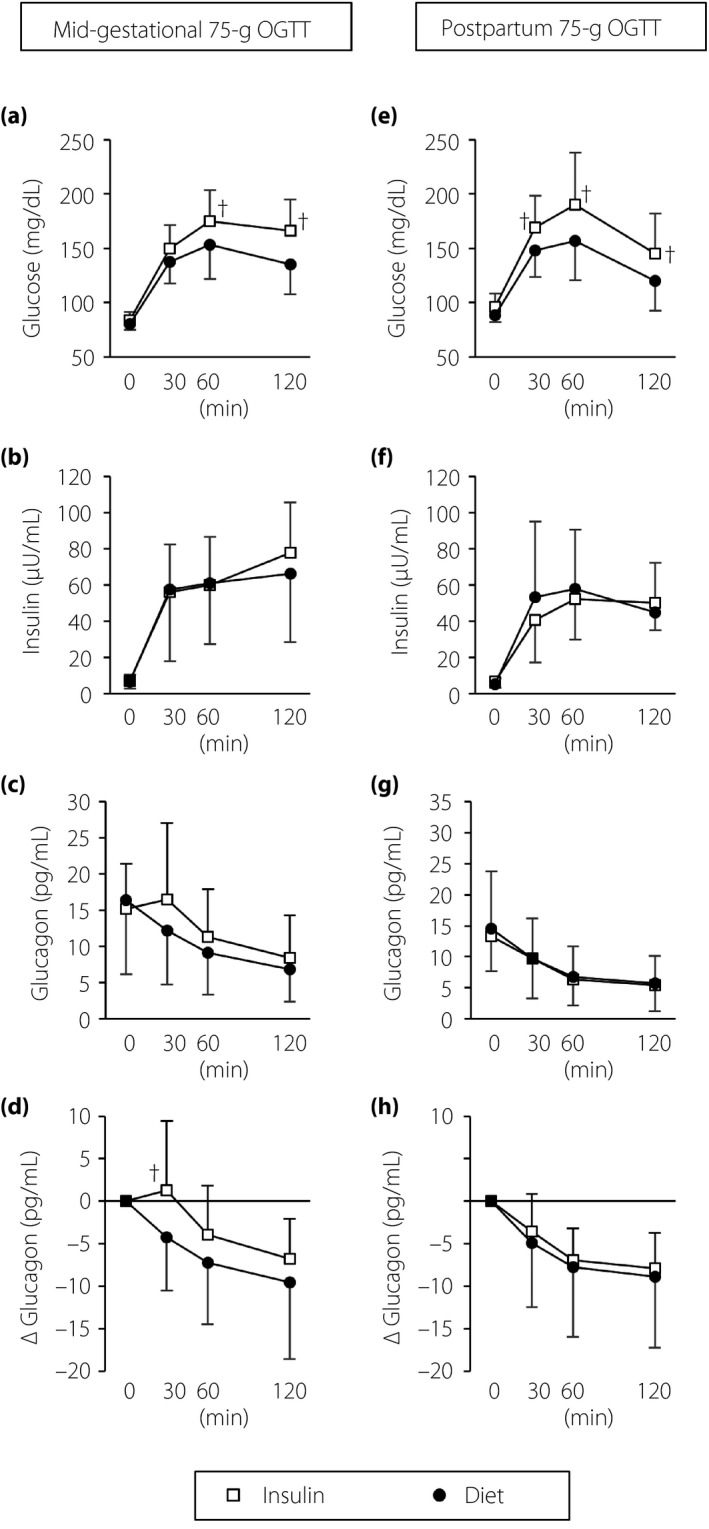
Figure 2.

Results of (a–d) the mid‐gestational oral glucose tolerance tests (OGTTs) and (e–h) the postpartum OGTTs. † P < 0.05 for the insulin treatment group (Insulin group) versus the diet therapy alone until delivery group (Diet group) calculated using a repeated‐measures anova. Open squares, the Insulin group; closed circles, the Diet group; bar lines, standard deviation.
