
Figure 3.
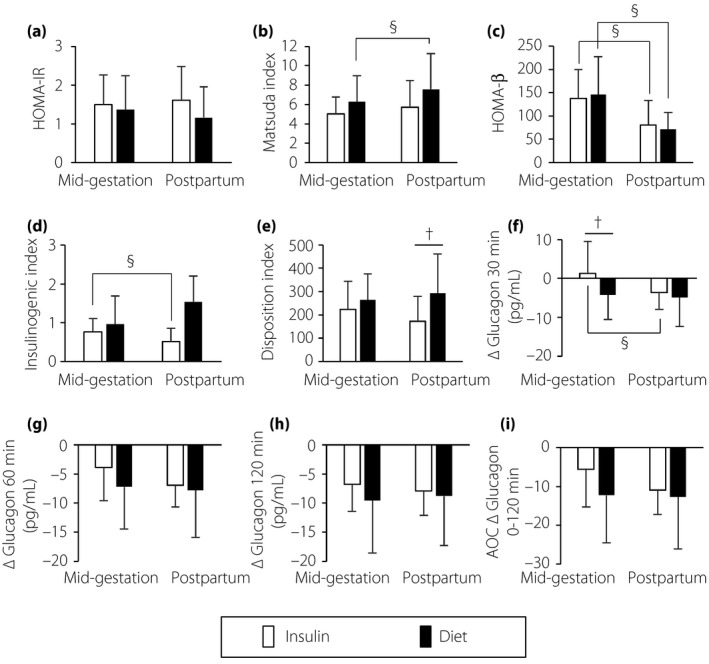
Comparison of indexes of (a,b) insulin sensitivity, (c–e) insulin secretion and (f–i) glucagon responses between the insulin treatment group (Insulin group) and the diet therapy alone until delivery group (Diet group) in mid‐gestation and postpartum. † P < 0.05 for the Insulin group versus the Diet group by the t‐test. § P < 0.05 for mid‐gestation versus postpartum in each group by the paired t‐test. White bars, the Insulin group; black bars, the Diet group; bar lines, standard deviation. ΔGlucagon, change in the levels of plasma glucagon from baseline (0 min) to each time point (30, 60 and 120 min) during each 75‐g oral glucose tolerance test; AOC, area over the ΔGlucagon curve; HOMA‐β, homeostasis model assessment for β‐cell function; HOMA‐IR, homeostasis model assessment for insulin resistance.